

- Objective
- Prerequisites
- 1 – Download the Cubike sample content
- 2 – Run the setup.py script
- 3 – Run the Data Integration with TM1py Jupyter Notebook
- Step1: Import packages and define constants
- Step 2: Build the URL Query
- Step2 – video
- Step 3: Query the Weather Data
- Step 3 – video
- Step 4: Rearrange the data
- Step 4 – video
- Step 5: Send data into TM1
- Step 5 – video
May 5, 2018
Upload weather data from web services into TM1/Planning Analytics
Python is a widely-used general-purpose programming language that lets you work quickly and integrate systems more effectively. TM1py enables you for the first time to get easily data from a multitude of systems and web services such as Trello, Salesforce, financial web services and many more… into your TM1/Planning Analytics application.
This help article is the first one on the series of articles focus around a fictional Bike Sharing company called Cubike operating in New York City, Washington D.C and Chicago.
The data for the series is real historic data provided from Bike Sharing companies in North America: Divvy, Capital Bikeshare and Citi Bike.
Objective
The objective of these articles is to explore and understand the impact of the weather and public holidays on our operative (bike sharing) business and subsequently use modern timeseries forecasting techniques to generate a rough two year forecast.
In this first article we will setup our working environment and upload weather data from a web service:
- Execute a python script that builds all the required TM1 objects for the series
- Write a python script to load daily historic weather data (Min, Max and Average by city) from a web service into a TM1 cube
If you are new to TM1py, we recommend you to start with the following article which is going to guide you in the installation of Python, TM1py and Jupiter:
Prerequisites
In order to run this sample you will need to install on your machine:
- IBM TM1 10.2 FP5 as minimum or Planning Analytics.
- Python, an extremely useful programming language for everything that is related to data.
- Pandas, a library which provides data structures and data analysis tools.
- TM1py, the python package for TM1.
- Jupyter (How to setup jupyter notebook).
1 – Download the Cubike sample content
We gathered all the files you need to run this example in the following zip file:
After downloading the zip file from above, unzip this file in any folder, you should see two Jupyter notebooks (.ipynb), four csv files and one python script:
- chicago.csv: Bike Sharing data from Chicago.
- Data Integration with TM1py.ipynb: Jupyter Notebook to load data into TM1 from a web service.
- Data Science with TM1py.ipynb: Jupyter Notebook to analyse the data.
- nyc.csv: Bike Sharing data from New Yord City.
- public holidays.csv: Public Holidays data.
- washington_dc.csv: Bike Sharing data from Washington DC.
- setup.py: Python script to create TM1 objects.
2 – Run the setup.py script
The setup.py script will create all Cubes, Rules, Dimensions, Subsets, Views, etc. that are required. Open setup.py and then update the TM1 settings which you will find at the top of the script:
- address: Server name where TM1 is installed
- port: HttpPortNumber value in tm1s.cfg
- user: TM1 admin user name
- password: TM1 password
- ssl: UseSSL setting in tm1s.cfg

IMPORTANT: Before running the script you should be aware that the Date, Version and City dimensions will be overwritten, if they already exist in the TM1 model!
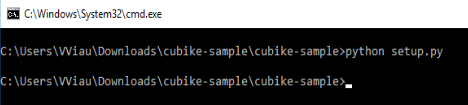
Now you are ready to run the script either with pycharm or from the command line. Open a Windows Command prompt window, navigate using the cd command to the setup.py folder location and then type:
- python setup.py
If the script fails, it is likely due to one of following reasons:
- Check the connectivity with TM1 instance.
- Check if TM1 REST API is enabled.
- Check TM1py version, it should be minimum v1.0.1.
After the script ran, you should now be able to see the following TM1 objects:
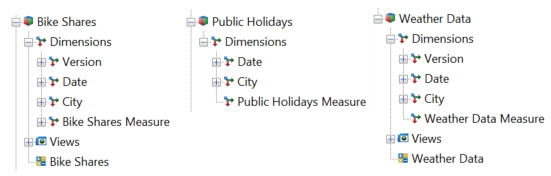
You are now ready to run the first Jupyter notebook!
3 – Run the Data Integration with TM1py Jupyter Notebook
For demonstration and documentation purposes all the python code in this series is distributed through Jupyter Notebooks. Jupyter Notebook is a web application that allows you to create and share documents that contain live code, equations, visualizations and narrative text.
To start Jupyter Notebook, you need to type the following command line in the folder where the notebooks are located:
- jupyter notebook
Once it has started, you should be able to access the jupyter notebook via the following URL:
- http://localhost:8888/tree
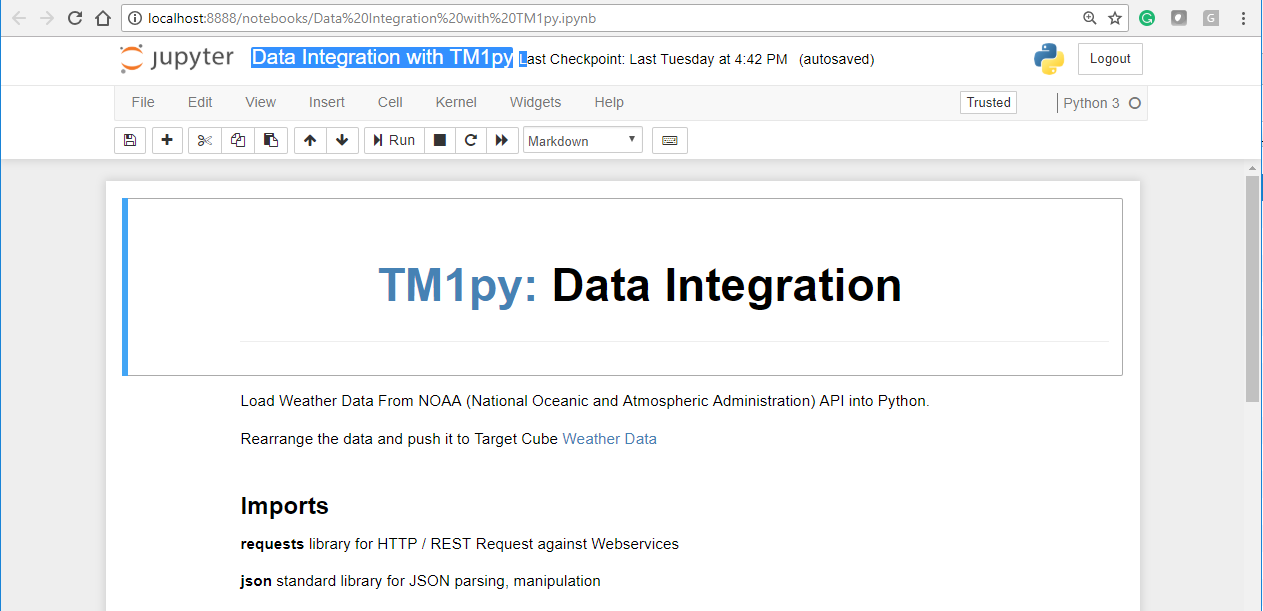
You can then click the upload button on the top right corner and select the first notebook that we are going to use: Data Integration with TM1py.ipynb.
Now click on the newly uploaded notebook and the notebook should be opened in a new tab:
Step1: Import packages and define constants
The first step in the Jupyter notebook is to import the packages and define the constants we need:
Step 2: Build the URL Query
We are pulling the weather data from the National Oceanic and Atmospheric Administation (NOAA). NOAA has a rich API which allows us to access all kind of environmental data from the US.
We use the following code to build the URL query:
url = 'https://www.ncdc.noaa.gov/cdo-web/api/v2/data?' 'datasetid=GHCND&' 'startdate=' + FROM + '&' 'enddate=' + TO + '&' 'limit=1000&' 'datatypeid=TMIN&' 'datatypeid=TAVG&' 'datatypeid=TMAX&' 'stationid=' + STATIONprint(url)
Step2 – video
Step 3: Query the Weather Data
Now that our URL is ready, we need to send the request to the API:
response = requests.get(url, headers=HEADERS).json()results = response["results"]
From the repsonse, we are storing the results into a new variable results. Then we print the first 3 objects:
print(json.dumps(results[0:3], indent=2))
Step 3 – video
Step 4: Rearrange the data
Before sending the data into TM1, we now need to rearrange the data so it matches our TM1 cube structure:
- Version = Actual
- Date = record[‘date’][0:10]
- City = NYC
- DataType = record[‘datatype’]
cells = dict()for record in results: value = record['value'] / 10 coordinates = ("Actual", record['date'][0:10], "NYC", record['datatype']) cells[coordinates] = valueStep 4 – video
Step 5: Send data into TM1
Now that the data is ready, we just need to connect to our TM1 instance and finally write the values into the TM1 cube “Weather Data”. With TM1py we can do this in two lines of code:
with TM1Service(address='10.77.19.60', port="12354", user="admin", password="apple", ssl=True) as tm1: tm1.cubes.cells.write_values("Weather Data", cells)Step 5 – video
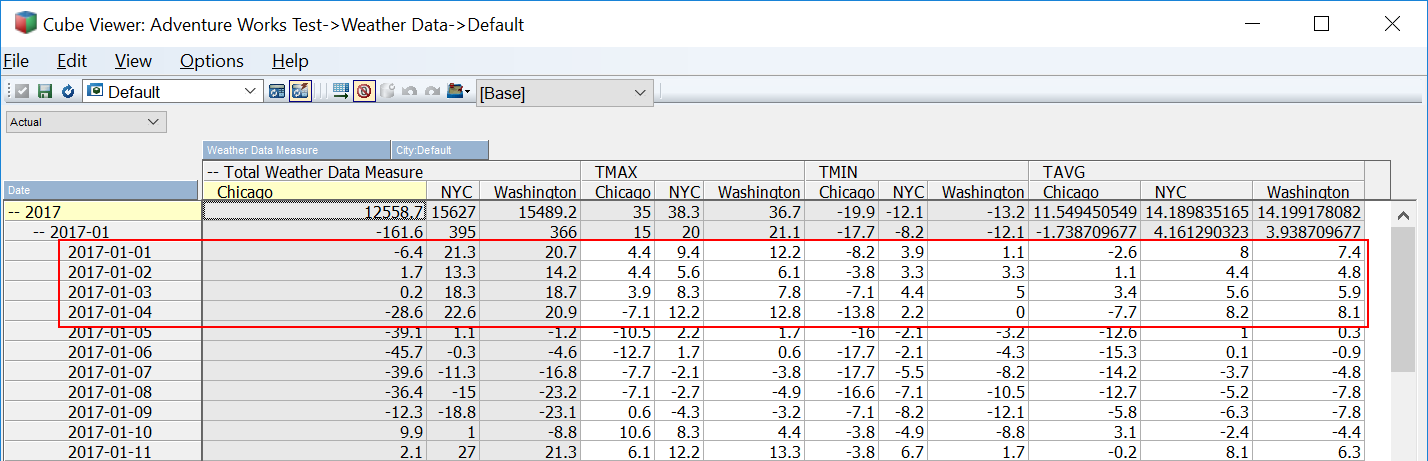
If you open the Weather Data Cube, you should be able to see some data for the first days of 2017:
We are now ready to start the second part of the series:
READ MORE: