Oct 1, 2022
Troubleshoot Faster by Analysing the tm1server.log in Pulse

Every IBM Planning Analytics (TM1) developer will be familiar with the tm1server.log – a file that contains important details about activity including executed processes, chores, loaded cubes, and much more…
However, when you are working with many different TM1 instances, it can be somewhat cumbersome to open several different tm1server.log files from different folders in order to understand what happened in your various applications. Too often, developers will end up with multiple files open and a lot of frustrating experiences digging in Notepad++.
Thankfully Pulse comes with stunning visualizations that are not only aesthetically pleasing but also very user-friendly. These help you to quickly understand what happened across all your servers without going through the tedium of opening different log files. In this way, Pulse can save you a lot of time and you will be able to spot potential issues that may have gone unnoticed.

All Your tm1server.log Messages in One Dashboard
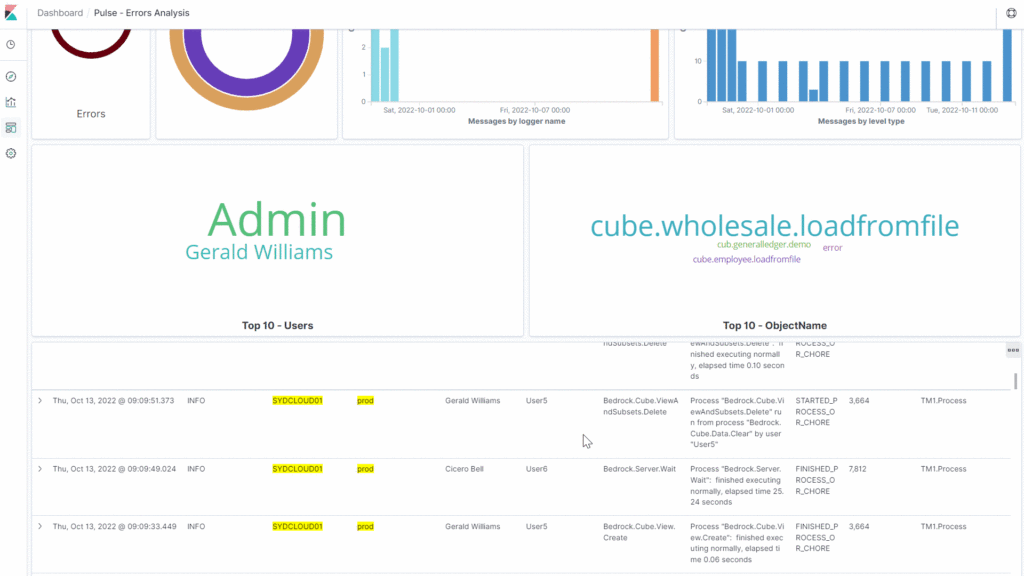
Pulse stores all of your server logs messages for all of your applications and makes them accessible to you through a very powerful search engine functionality. In one dashboard you can see the server log messages for all your instances second by second – giving you a level of granularity that can be game-changing. On top of that, it also comes with beautiful visualizations that allow you to quickly see if there is an issue, as well as where and when it occurred. This will save you heaps of time when you want to understand what was running at a specific time in the past:

Filter by User and Object Type
The Pulse Explorer dashboards are very user-friendly and are built to enable better productivity and transparency in your system. Just click on the visualizations to apply whatever filters you want on the dashboard. For example, you can click on a server name to see only the logs from this server. Or alternatively, you can click on a specific username to see what this user has executed:

Flexible in Terms of Period and Custom Filters
The Pulse Explorer dashboards also include a very flexible date picker. This makes it easy to filter by period – allowing you to switch seamlessly between hours, days, weeks, or months. Then in a visualization, you can select a specific period and apply this new filter on the dashboard. This is very helpful if you want to zoom into a potential issue and isolating the time period in question helps you cut through the noise.
In addition, the Pulse Explorer includes a filter box that can be used to apply custom filters. For example, you could remove all bedrock processes by typing: NOT Name: *edrock*

Say Goodbye to the tm1server.log and Say Hello to the Pulse Explorer!
If you are already using Pulse, we hope that this article has shown you just how powerful the Pulse Explorer can be (including since Pulse v6) and that as a TM1 administrator you don’t need to open the tm1server.log file anymore!
If you are not using Pulse yet, please reach out to us here, if you’d be interested in doing a trial. Pulse is available on Windows, Linux, and on the Cubewise Cloud for IBM PA SaaS customers.
You can also find more information about the Pulse Explorer here.