Sep 3, 2019
5 hidden gems in Pulse that will change your life

If you’re using Pulse to monitor your IBM TM1 and Planning Analytics applications, this article is for you! Not using Pulse yet? Click here to learn more.
Pulse does so much more than monitoring your IBM TM1 and Planning Analytics applications. In this article you will find the top 5 hidden gems in Pulse that will change your life.
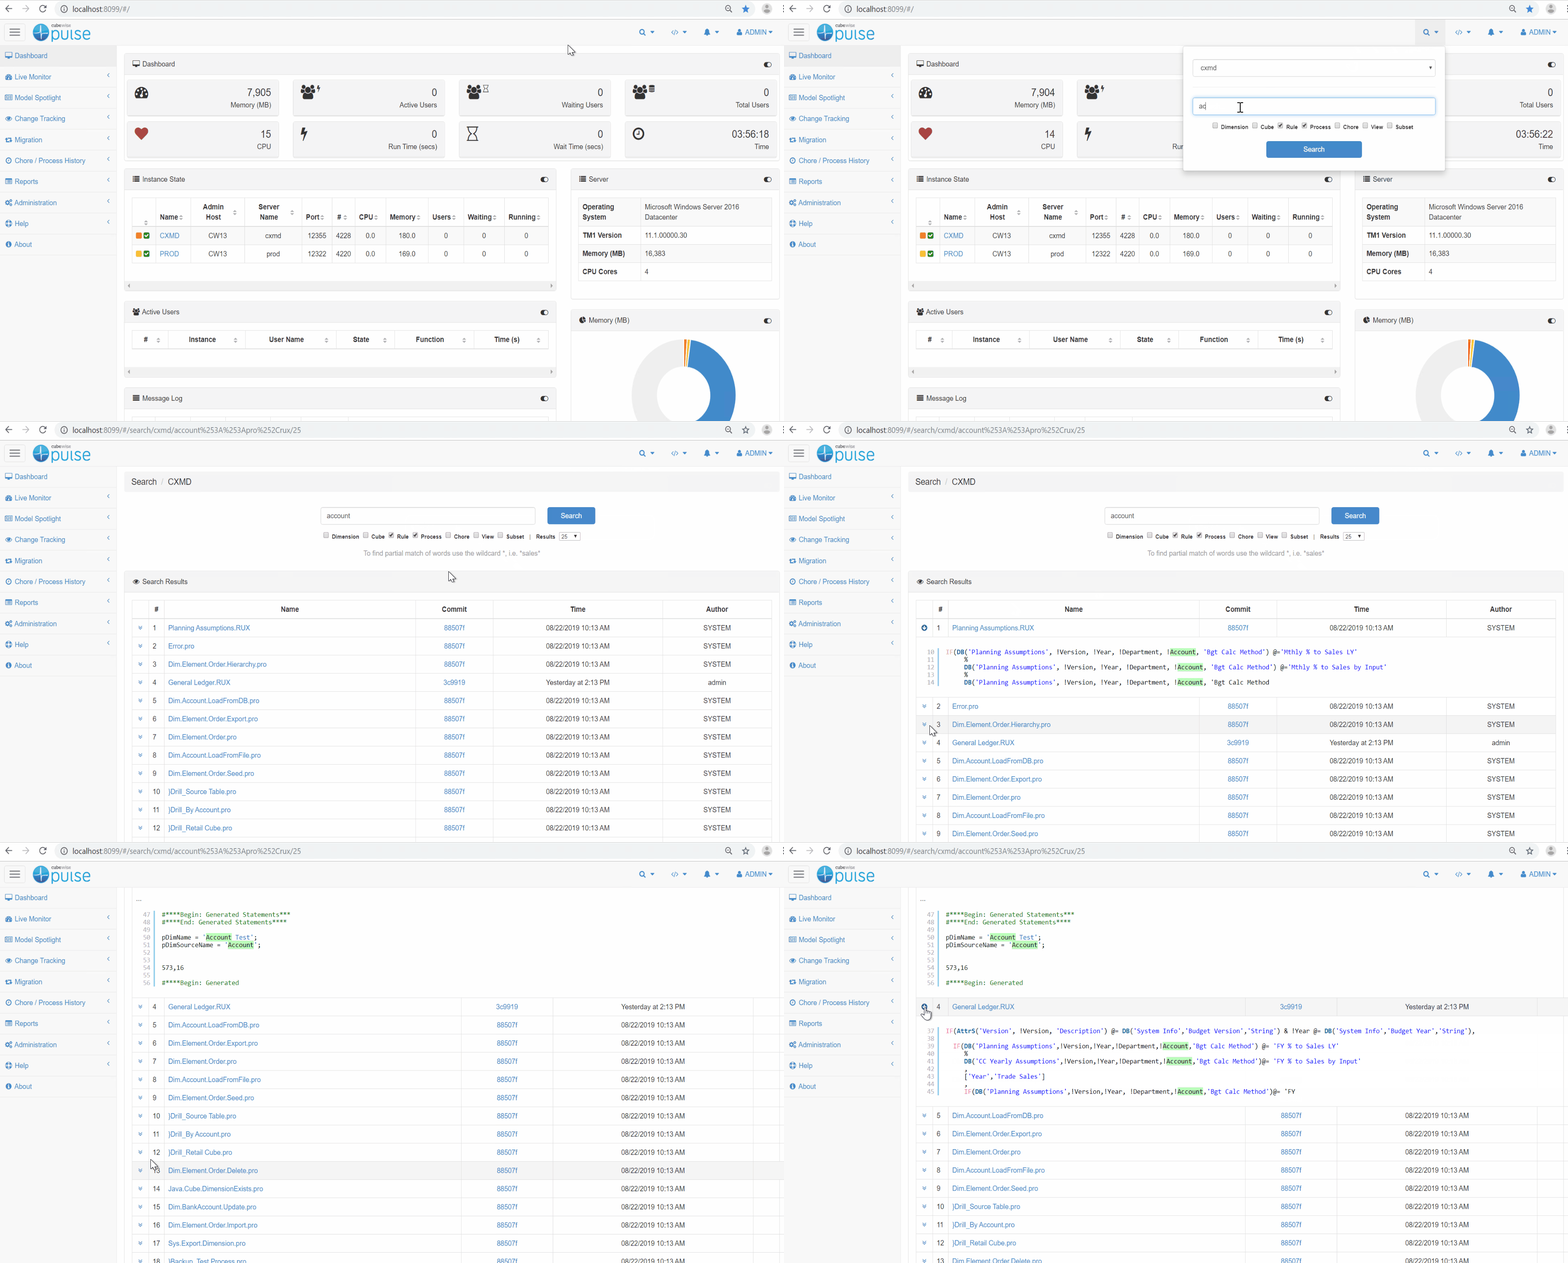
Search among all your objects
The Search box – this is definitely an underutilized feature in Pulse. The search icon is in the top right of the screen (regardless of where you are in Pulse), and can be very handy if you are, for example, looking for all references (Rules, TI, etc.) to a single element, or looking to see which processes reference a particular attribute. Give it a try!
Find all your rules connections
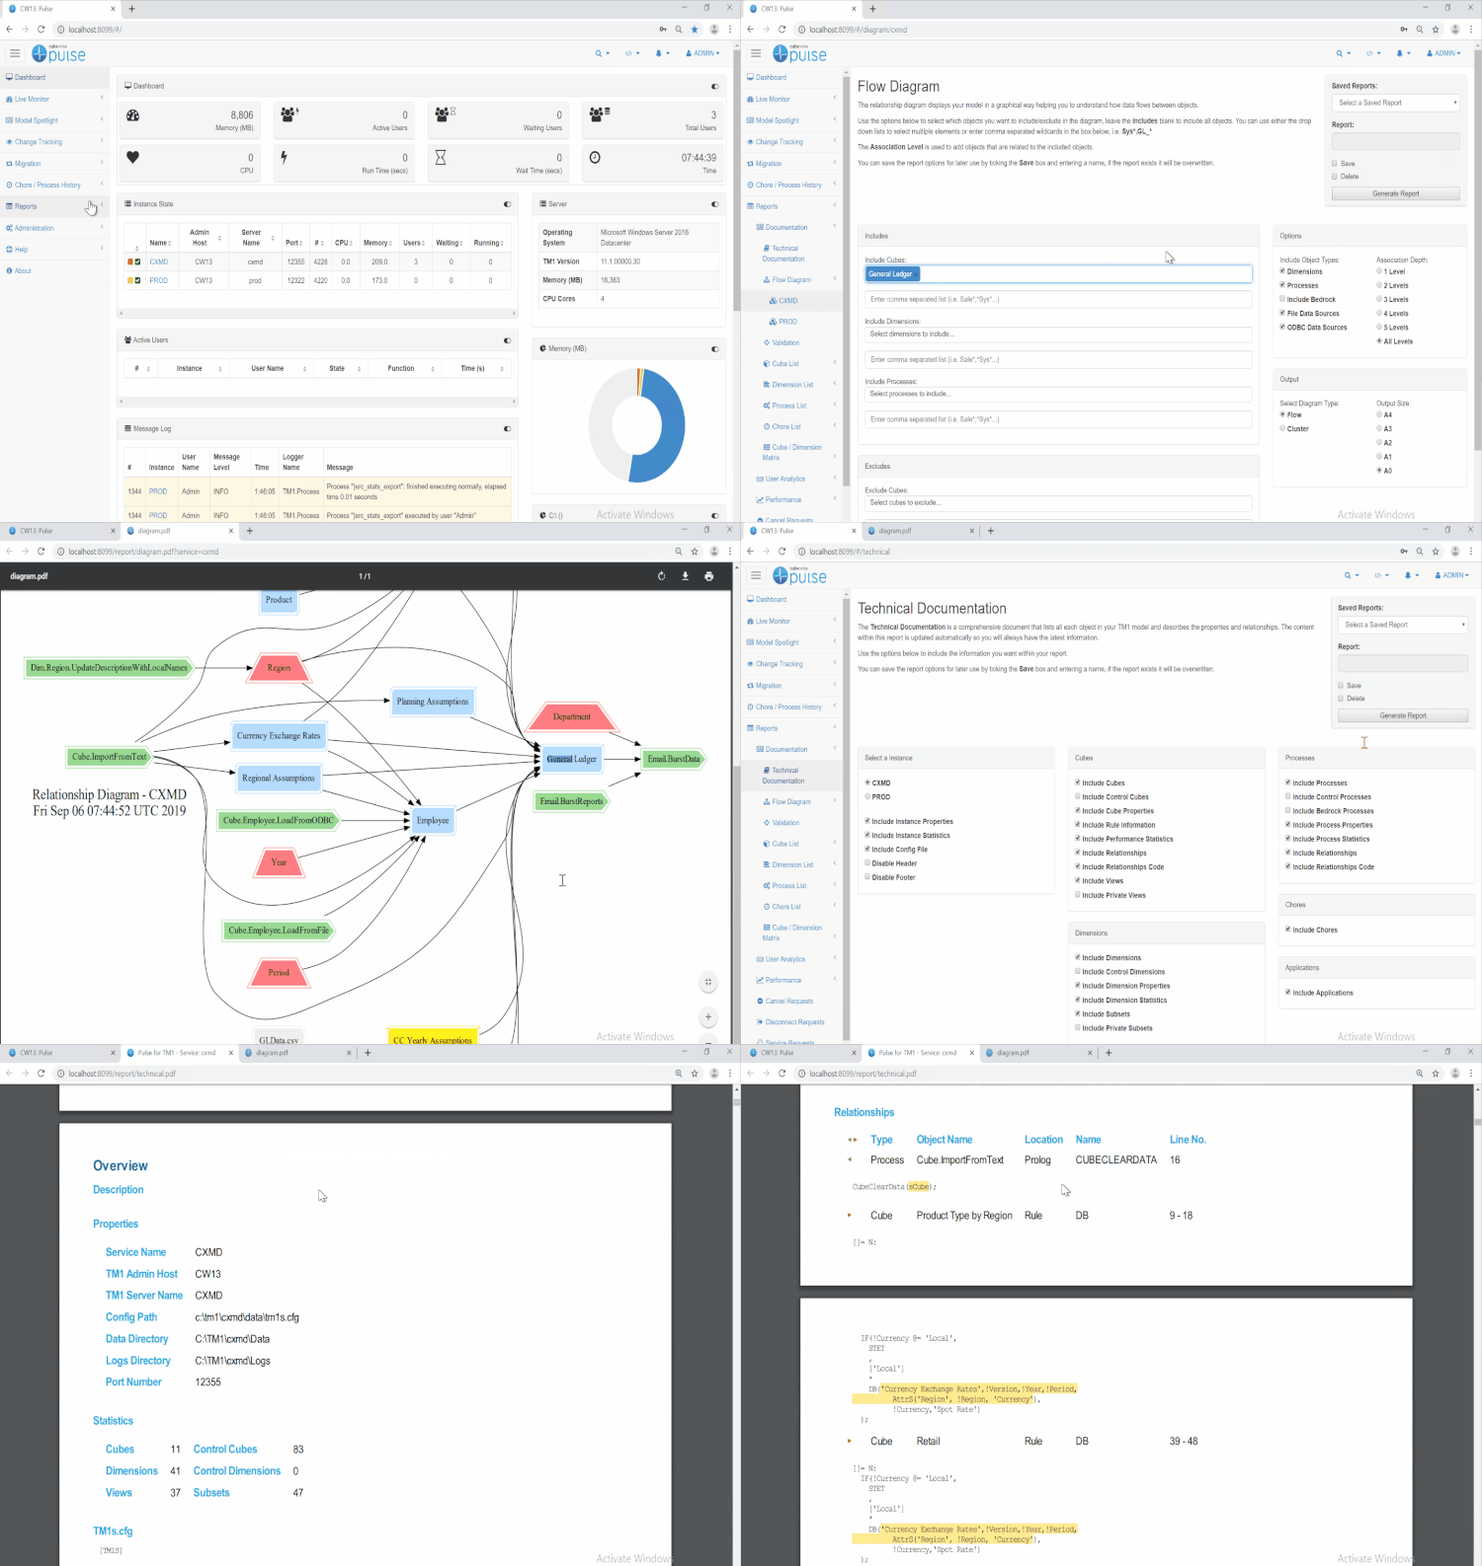
Rules connections – there are several places you can analyze the rules connections in your model:
- In the Flow Diagram, the lines between cubes indicate that they are connected via Rules
- In the Model Spotlight, the box on the right shows “relationships” – the blue items are cube/rules connections, and the green are TI
- To see the specific rules that are driving that connection, run the Technical Documentation (be sure to check the box that says “include rules information”)—this will show the rule stats for the cube itself, as well as the rule code snippets for each cube connection (look for the “relationships” section by cube once you have created the technical documentation, as shown below)
Monitor TM1 Web activity
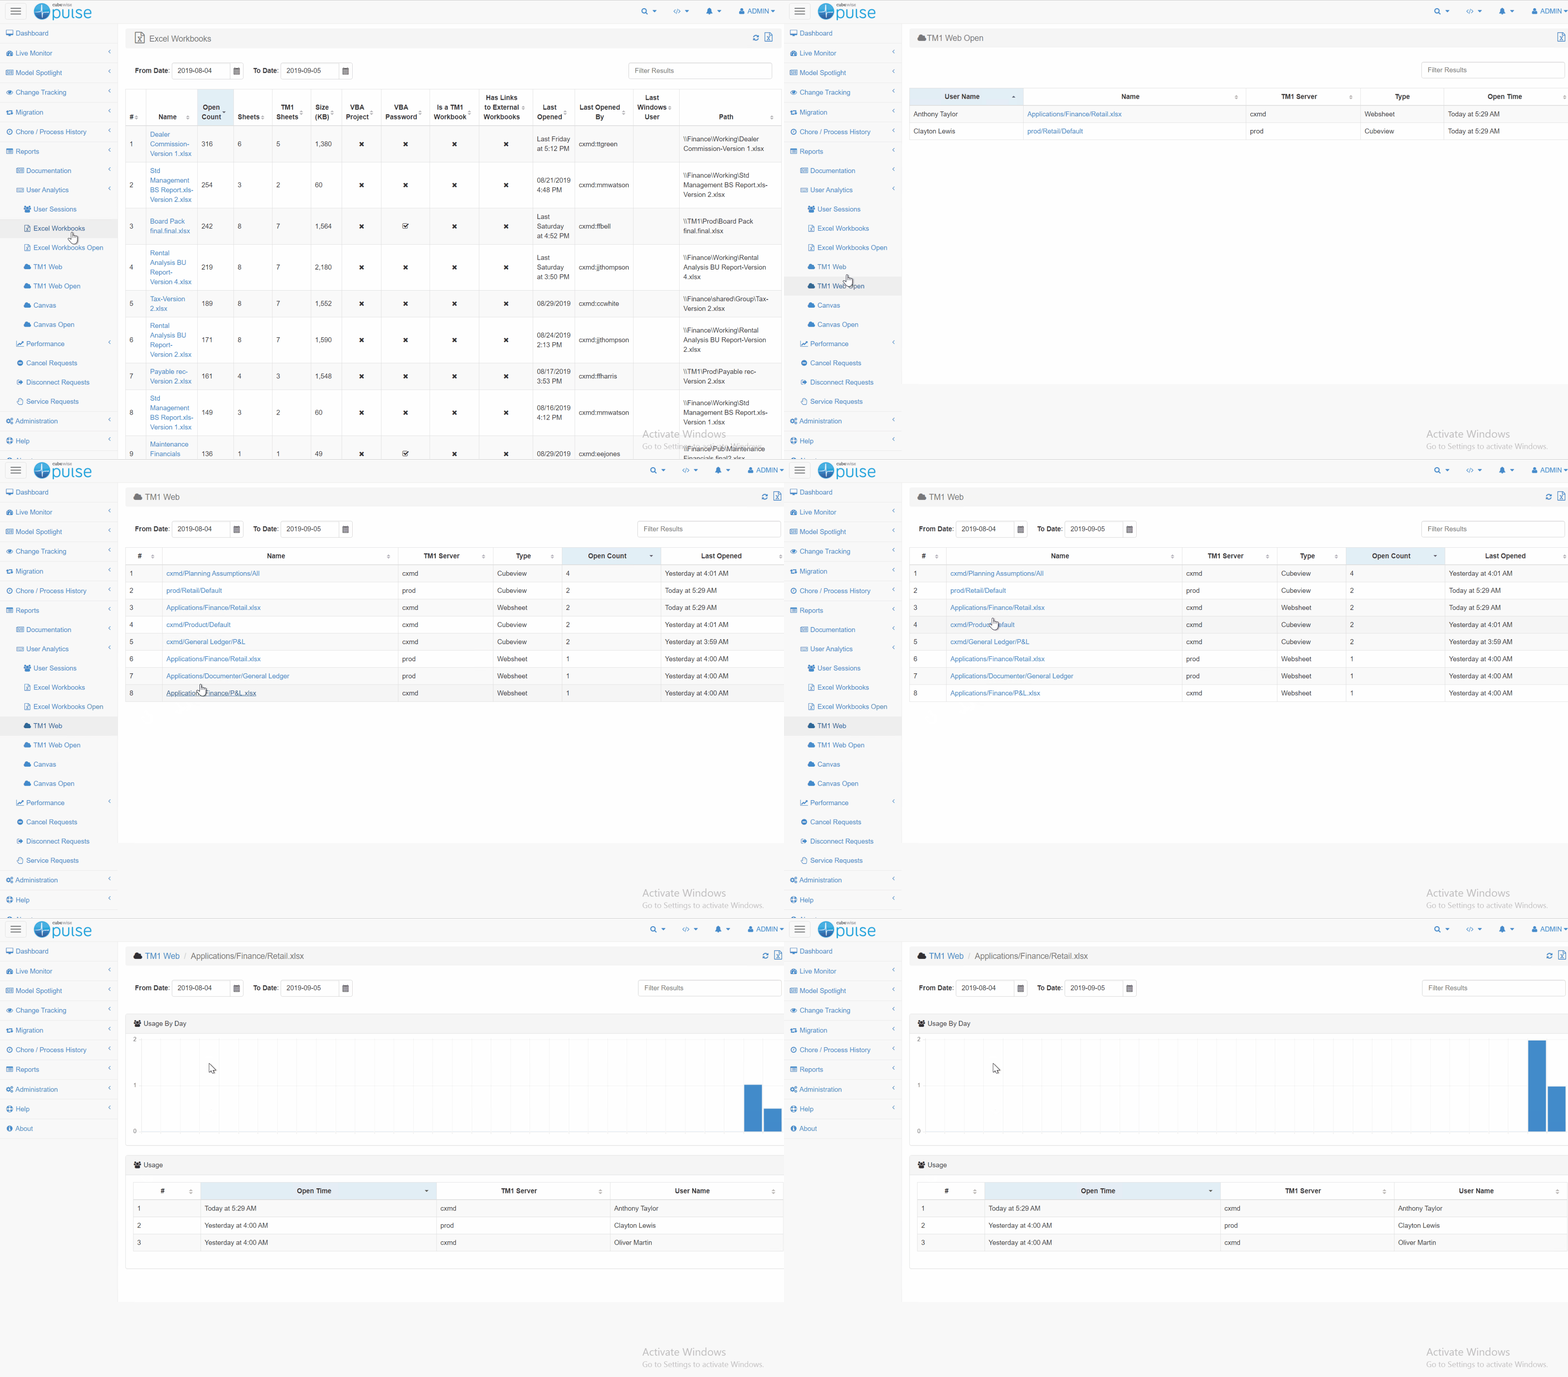
Did you know you can monitor your TM1 Web activity using Pulse? Pulse can monitor TM1 Web, Excel and Canvas activity. If Pulse is co-hosted with TM1 Web, you simply need to turn on “Insert Web Logging Script” on the Admin/Configuration page. If TM1 Web is housed on its own server, there are a couple of steps to point Pulse to the TM1 Web location. You can see the instructions here —note that the setup is different depending on which version of TM1/PA you are using.
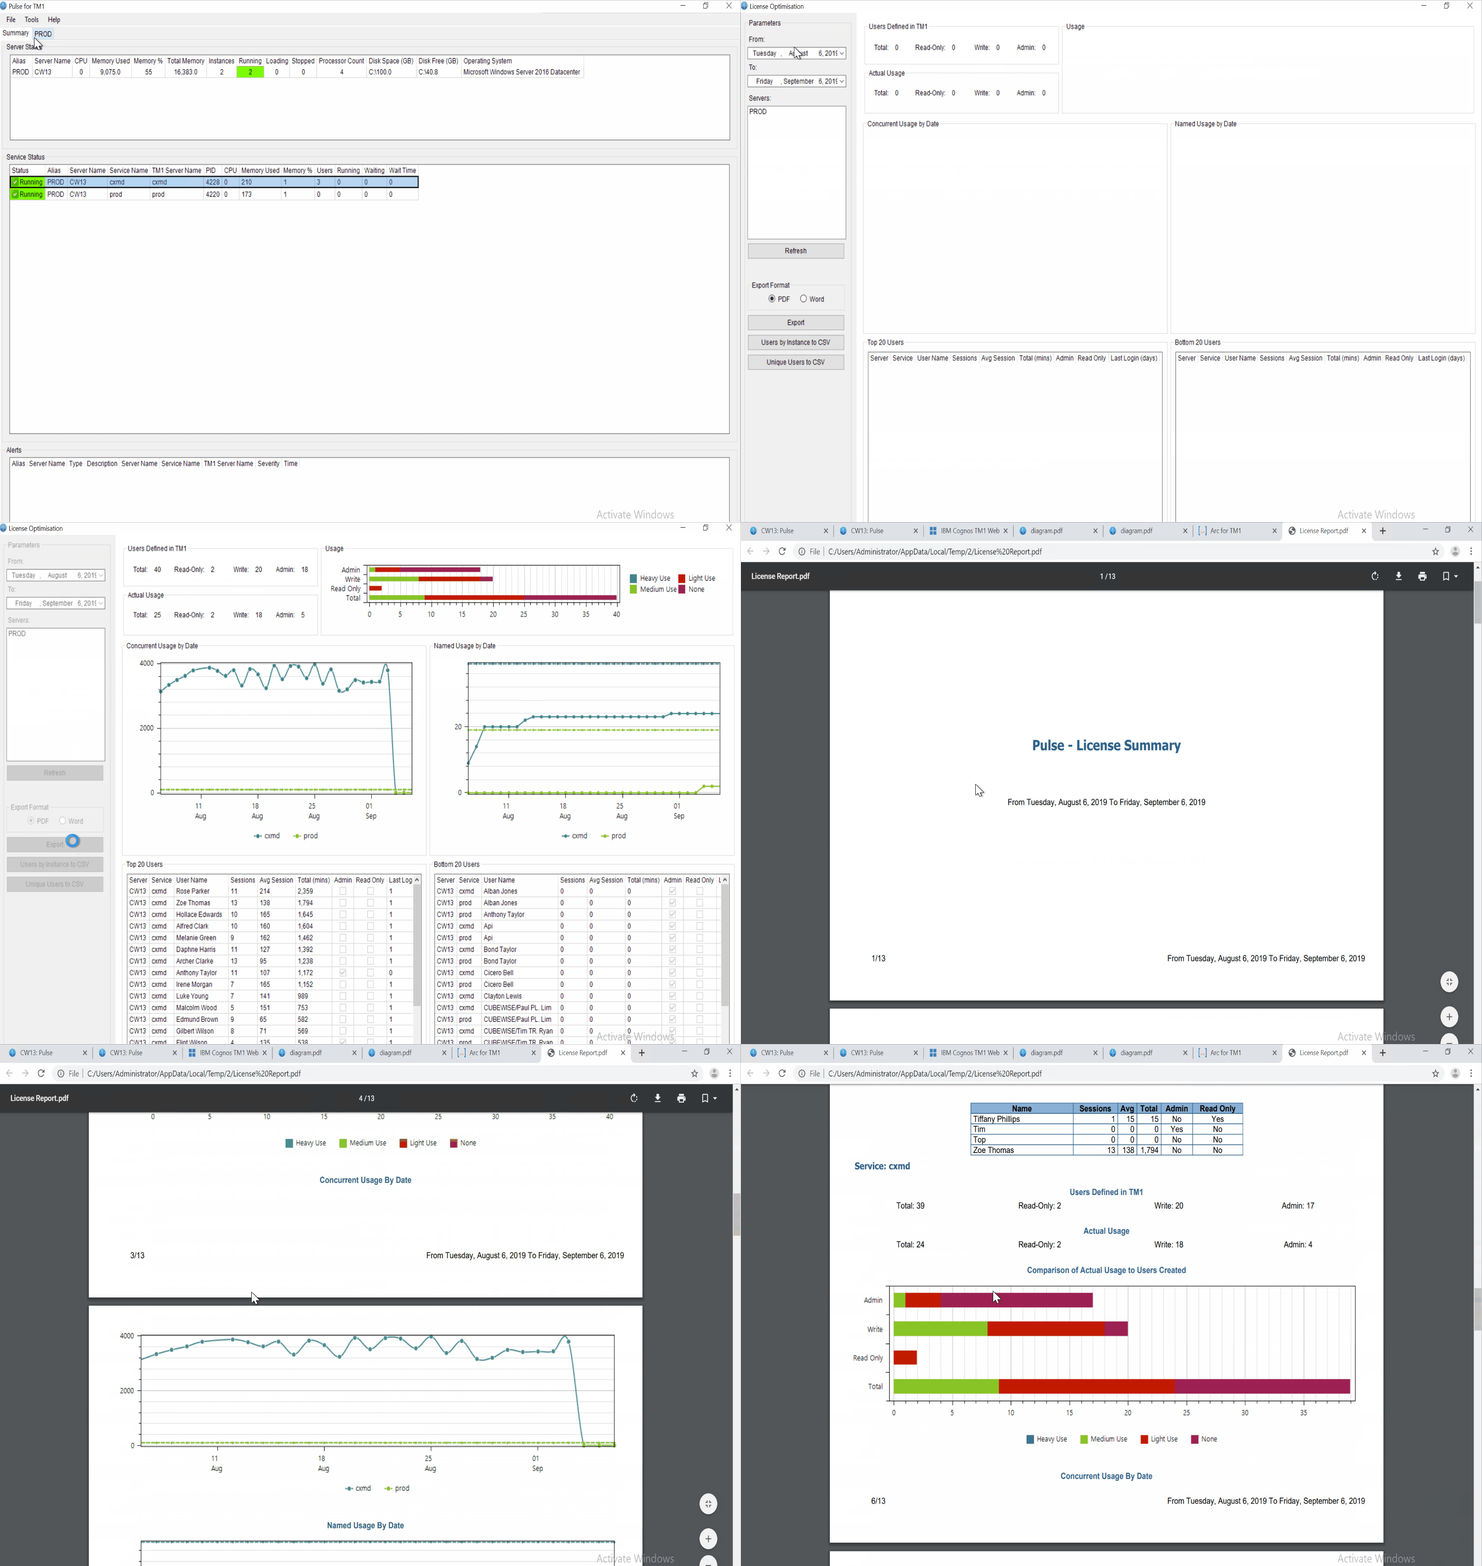
Run the License Optimization Report
Pulse tells you exactly who is using the application, when are they using it, how often are they using it and the type of user they are (Admin, Read-Only or Write). To run this report you will need to go to the Pulse Thick Client:
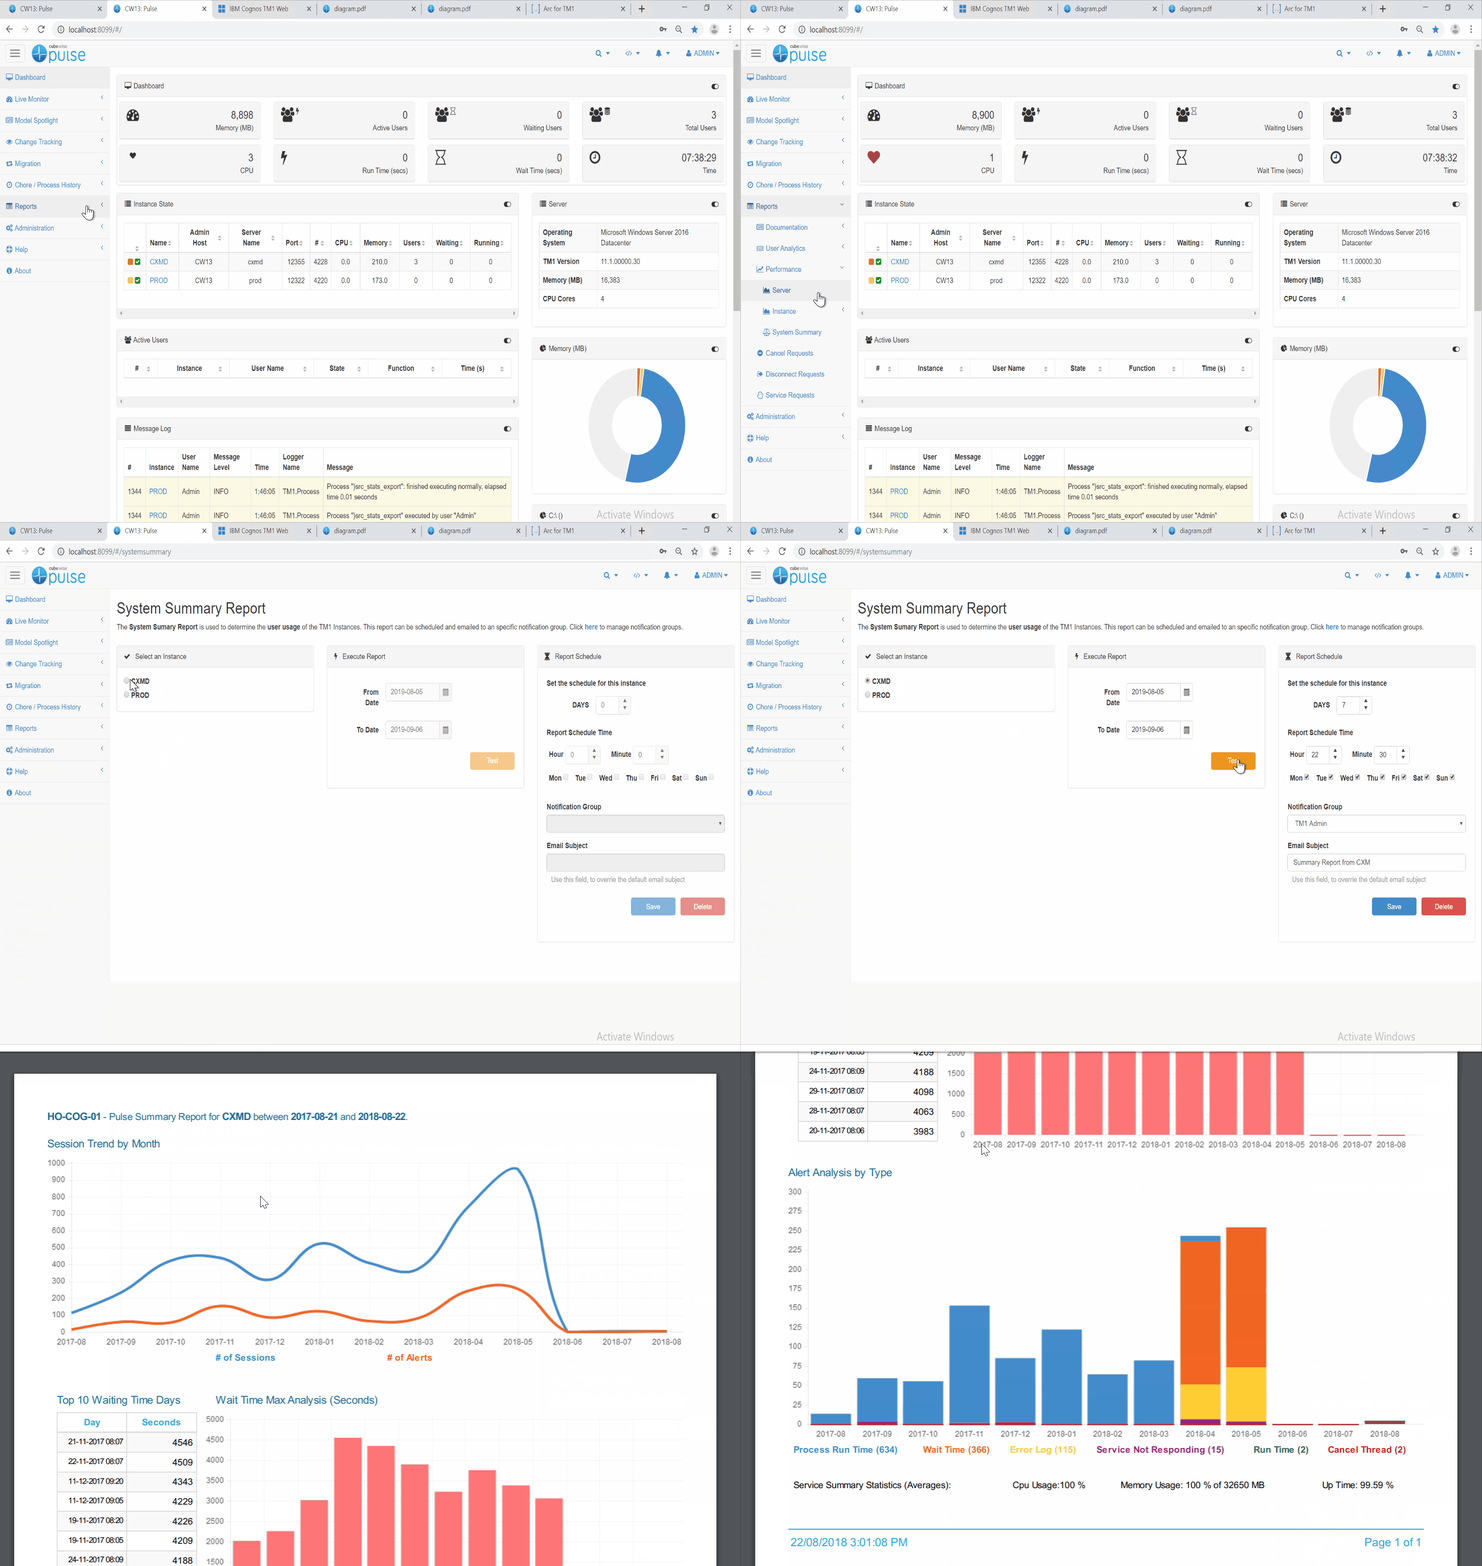
Schedule the System Summary Report
Pulse v5.8 introduces a brand-new report, the System Summary Report. This report will help TM1 administrators to monitor the health of their TM1 instances.
This report gathers all the most important Pulse data that you should look at when doing a health check of a TM1 instance such as user sessions, wait time and alerts.
It is recommended to schedule this report so you can keep track of the evolution of your systems.
