

Jul 4, 2019
Working with Pandas dataframes with IBM TM1 and Planning Analytics
Pandas is probably the most important Python library that you should be aware of if you want to write Python scripts on top of your IBM TM1 and Planning Analytics data.
IBM TM1 and Planning Analytics is well known for its very powerful calculation engine. It comes with a lot of built-in functions. For the calculations missing, you could choose to write yourself the algorithm in TM1 rules or TM1 processes but a more efficient way to do this would be to ask Python to do these calculations for you. In the Python eco-system you will find thousands of libraries and it is very likely that the calculation you are looking is already available in one of these library.
The calculation we want to do in this article are called rolling/moving median and standard deviation, these calculations are available in Pandas. We will proceed in three steps:
- Get data out of TM1 in a Pandas dataframe
- Do the calculation using Pandas
- Send it back to our TM1 cube

If TM1py is installed in your environment, you do not need to install Pandas as Pandas is dependency of TM1py so it will get installed when you install TM1py.
Step 1: Getting data out of TM1 as a dataframe
To get data out of TM1, we use TM1py. TM1py handles the authentication with TM1 and provides us with a lot of useful functions to read data from TM1.
To access TM1py functions, we need first to create an object called tm1 containing all TM1Service properties:
# Create the TM1 service
from TM1py.Services import TM1Service

tm1 = TM1Service(address='localhost', port=8009, user='admin', password='apple', ssl=True)
In this example we are getting data for three city (NYC, Chicago and Washington) between two dates (2014-01-01 to 2017-12-31) for Actual and the measure Count using the following MDX statement:
# This mdx will be used as data in this example
mdx = """
SELECT
NON EMPTY {[Date].[2014-01-01]:[Date].[2017-12-31]} ON ROWS,
{[City].[NYC], [City].[Chicago], [City].[Washington]} ON COLUMNS
FROM [Bike Shares]
WHERE ([Bike Shares Measure].[Count], [Version].[Actual])
"""
There are different way to convert the data coming from TM1 into a dataframe, we could first get the data using tm1.cubes.cells.execute_mdx and then build the dataframe using build_pandas_dataframe_from_cellset:
# retrieve a dictionary through TM1py and build a DataFrame from it
from TM1py.Utils.Utils import build_pandas_dataframe_from_cellset

data = tm1.cubes.cells.execute_mdx(mdx)

df = build_pandas_dataframe_from_cellset(data, multiindex=False)
To show the first 5 records we use df.head():

As the Version and Bike Shares Measure are fixed, it would be cleaner to remove them from this dataframe and only keep the Date, City and Value.
To get the values with only the dimension on rows and columns we can use the function tm1.cubes.cells.execute_mdx_dataframe:
# retrieve DataFrame directly
df = tm1.cubes.cells.execute_mdx_dataframe(mdx)
df.head()

Now we need to transform this dataframe to have one date per row with the value for each city on columns. The for loop below will do just that:
# Transform into something more convenient
for city in ('NYC', 'Chicago', 'Washington'):
    df[city] = df.apply(lambda row: row["Value"] if row["City"] == city else None, axis=1)
df.drop(columns=["Value"], inplace=True)
df = df.groupby("Date").sum()
df.head()

To avoid having to transform our dataframe (the for loop above) into a pivot we could use the TM1py function execute_mdx_dataframe_pivot:
# retrieve a pivot DataFrame from a cubeview / MDX Query
pivot = tm1.cubes.cells.execute_mdx_dataframe_pivot(mdx)
With one line of code, this function will give you the same result as above.
Step 2: Calculate the rolling median and deviation
All right so now we have a Pandas dataframe called df so we can leverage all Pandas properties such as:
- df.tail() to get the last 5 records
- df.sample(n) to get n random records
- df.loc[‘2016-08-11’][‘NYC’] to access one cell
- pivot.loc[(“2017-12-31”)] to access all cells for one date
- df.sort_values(by=[‘NYC’], ascending=True) to sort
- df.loc[lambda df: df[‘NYC’] > 74000] filter
- df.head().T Transpose
A very powerful property is df.describe() to get a summary of the data:
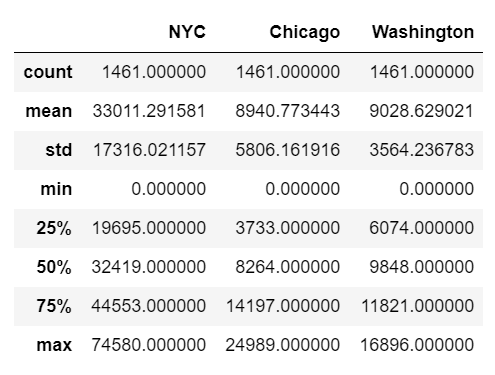
To calculate the rolling median and rolling standard deviation, we will use first the property rolling to define the number of records we want to calculate the median and then we called .median() to calculate it. To create a new column we use df[‘NYC Rolling Median’]. The following code will create a new column with the rolling median of NYC:
df['NYC Rolling Median'] = df['NYC'].rolling(window=10,).median()
To create a new column with the standard deviation for NYC we use the code below:
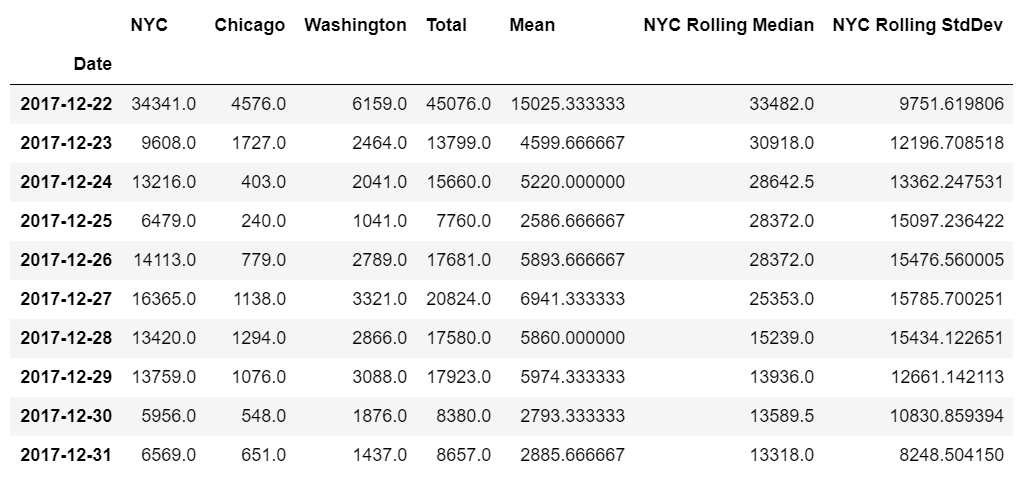
df['NYC Rolling StdDev'] = df['NYC'].rolling(window=10,).std()
We can see now the two new columns in our dataframe:
Step 3: Write back to TM1
To write back our two new columns into TM1, we define first a new dataframe containing only these two new columns.
df_writeback = df[['NYC Rolling Median', 'NYC Rolling StdDev']]
To replace NA values by 0 we use the fillna(0) function:
df_writeback = df_writeback.fillna(0)

The cell set that we send back to TM1 has to contain one element per dimension so we just need to add the version Actual, the city NYC and the two new measures:
# Declare the cellset
cellset = {}
# Prepare the cellset
for date in df_writeback.index:
    cellset[('Actual', date, 'NYC', 'Rolling Median')] = median = df_writeback.loc[date]['NYC Rolling Median']
    cellset[('Actual', date, 'NYC', 'Rolling StdDev')] = stddev = df_writeback.loc[date]['NYC Rolling StdDev']
Once our cellset is ready we just need to call the TM1py function cubes.cells.write_values with the cube name and the cellset as parameters:
tm1.cubes.cells.write_values("Bike Shares", cellset)
If you get the response 204, it means that the data has been updated into your TM1 cube.
You can run this example in your environment using the TM1py samples called pandas_in_depth from the Samples folder:
The easiest way to test it is to download the TM1py Samples repository.