Jul 5, 2024
Syncing hierarchies: TM1 and Power BI
A fundamental and very powerful feature of IBM Planning Analytics (TM1) is the use of hierarchies/consolidations, which play a crucial role in organizing and analyzing complex data sets in your model.
Hierarchies are structured ways to organize data into different levels of granularity. They allow users to drill down into data, providing insights at various levels of detail. Whether it’s breaking down sales by region, then by country, and further by city, or analyzing financial data from the overall company level down to individual departments, hierarchies facilitate comprehensive and multi-layered data analysis.
TM1 dimension hierarchy levels in Power BI
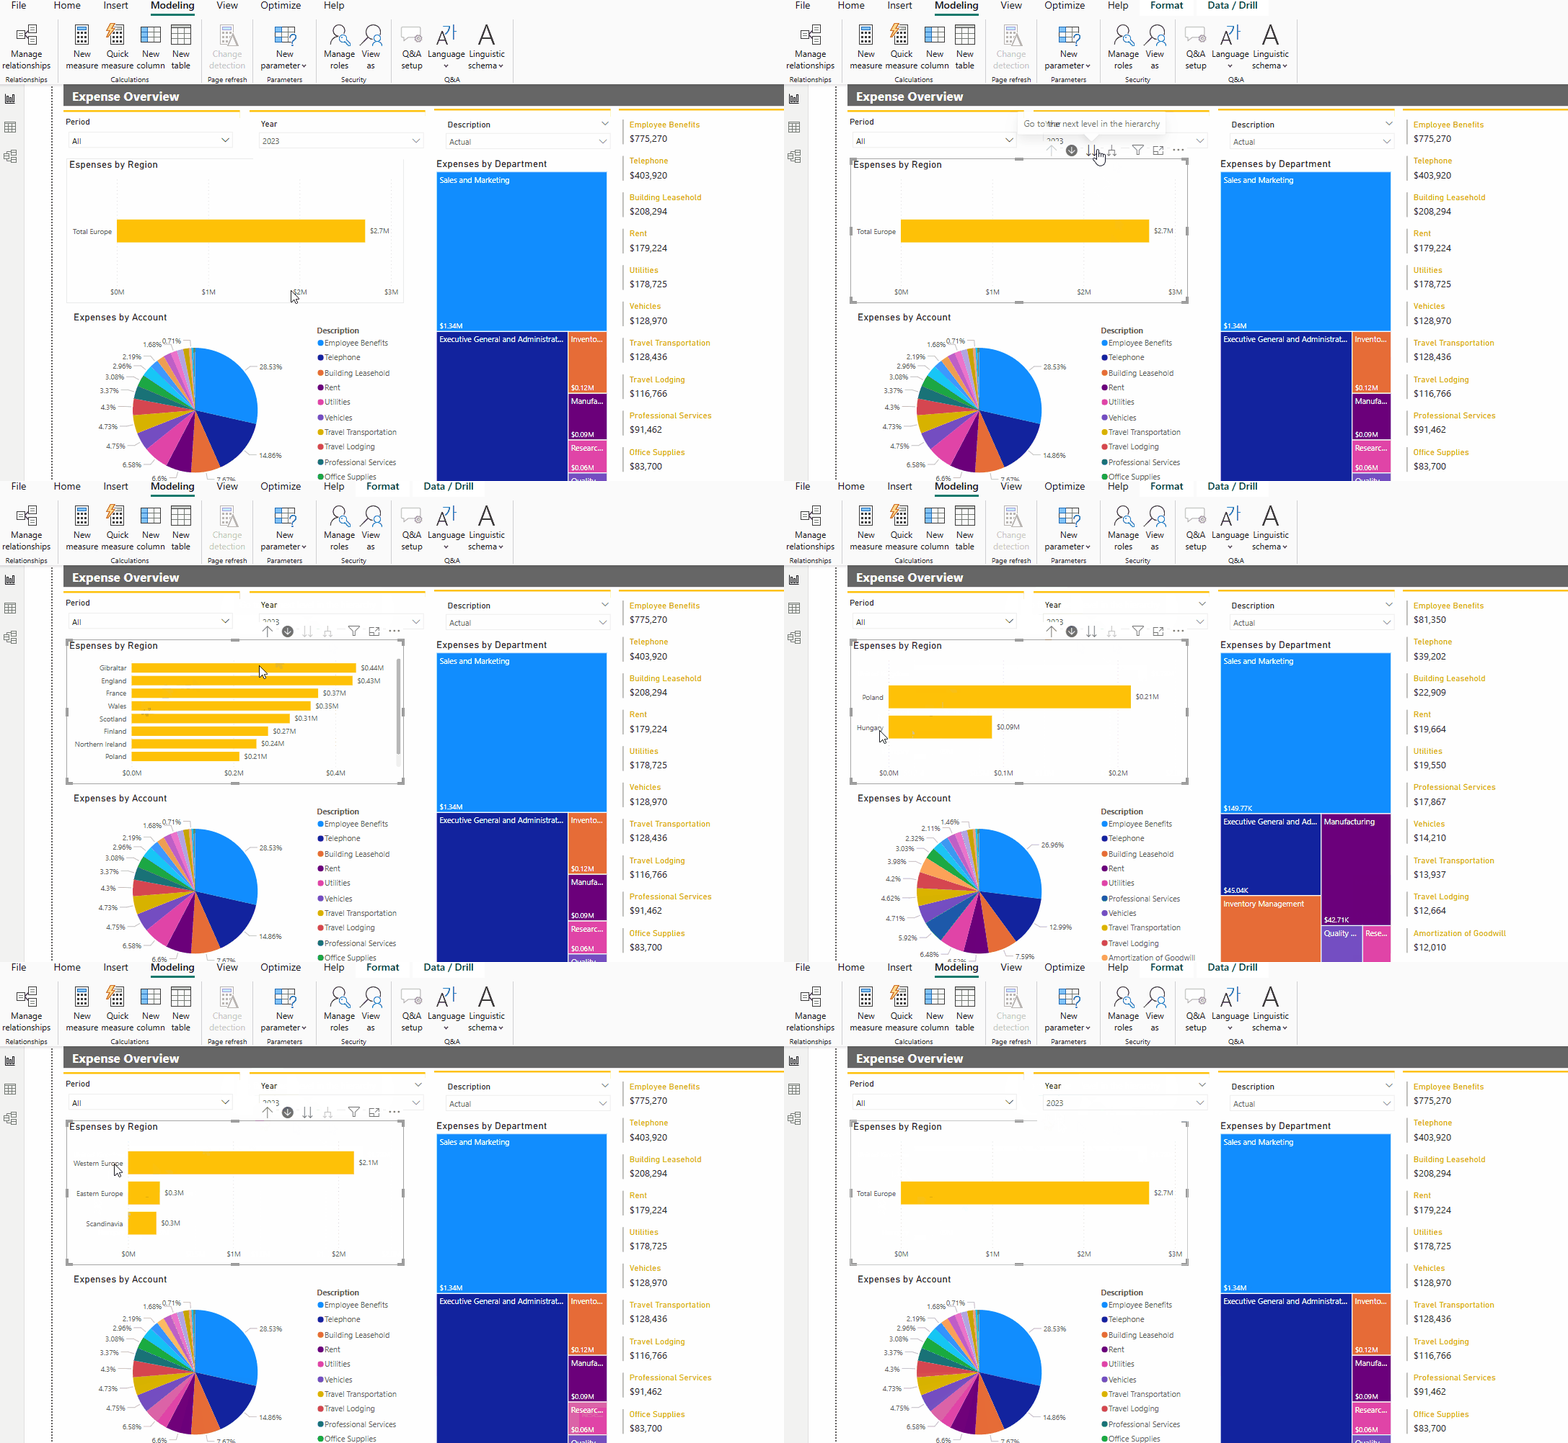
How can I see my TM1 dimension hierarchy levels in a Power BI dashboard? Well, you can create hierarchies in Power BI by defining relationships between columns in their data models. These hierarchies enable users to navigate through different levels of data seamlessly within reports and dashboards. For example, a region hierarchy can allow users to drill down from the top-level total down to individual locations.
With PowerConnect you can now seamlessly enable the creation and maintenance of TM1 hierarchies in Power BI, enhancing the depth and breadth of data analysis. Visual interactions, such as slicers and filters, work seamlessly with hierarchies, enabling users to gain insights quickly and intuitively.
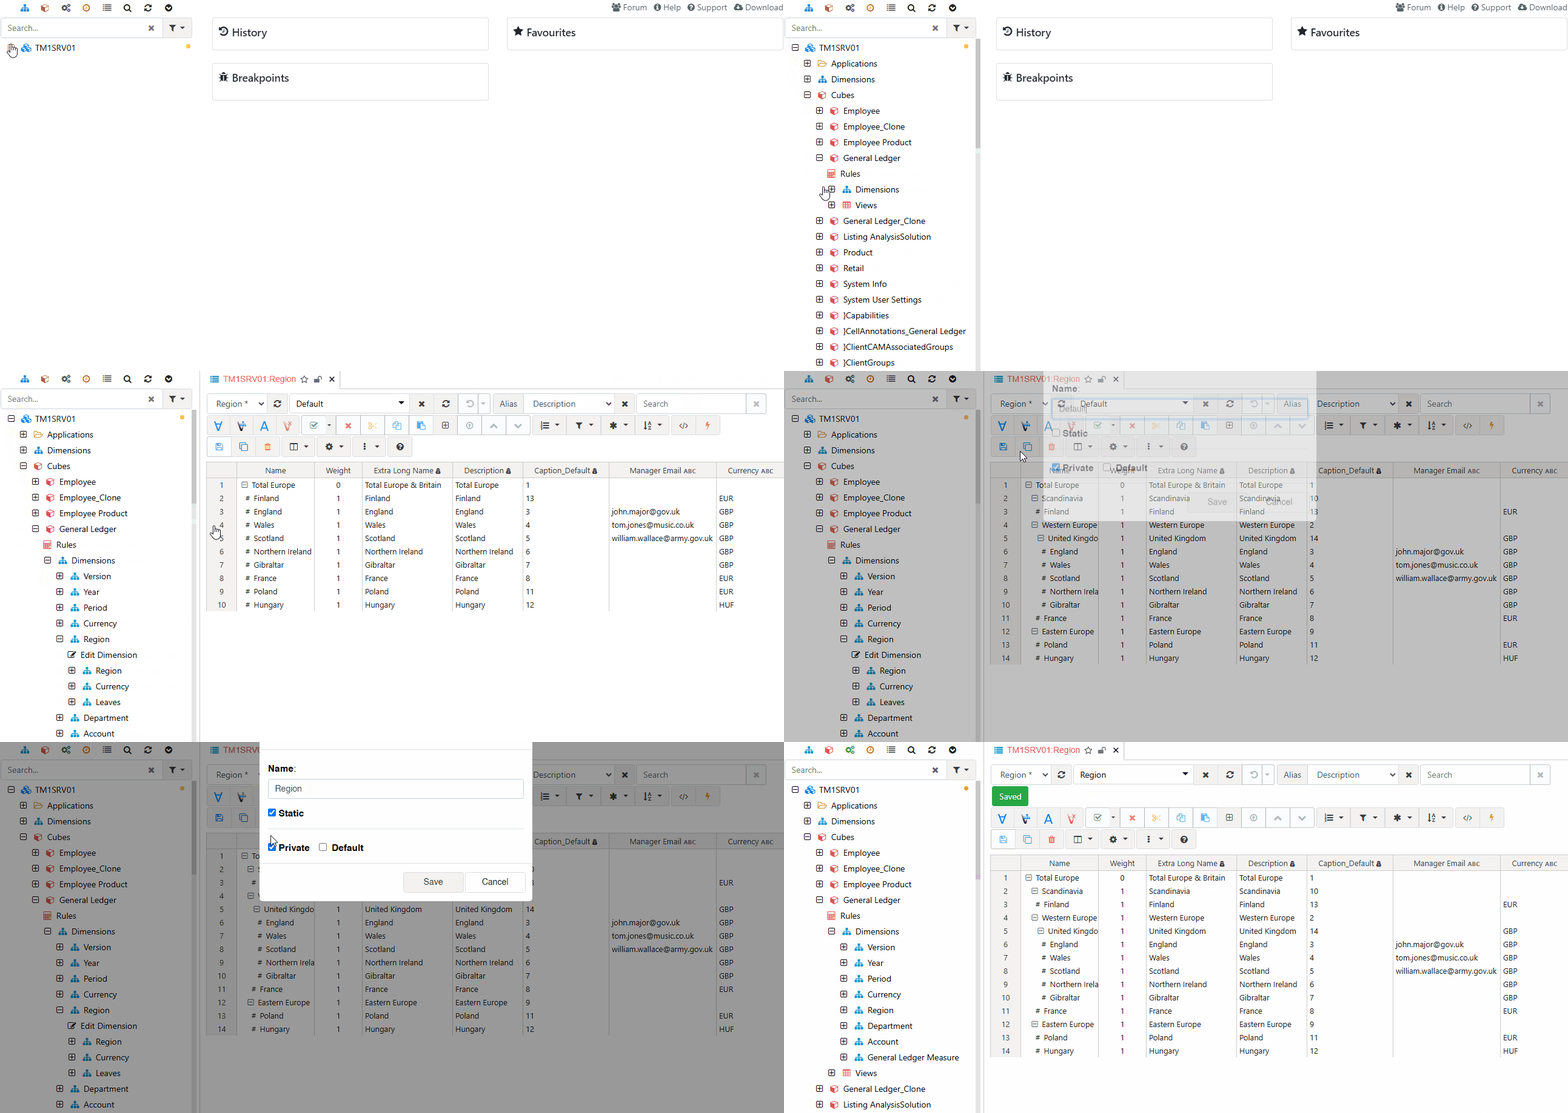
Let’s us show you how. First and foremost, we are going to create a TM1 subset called “Region” for the region dimension.

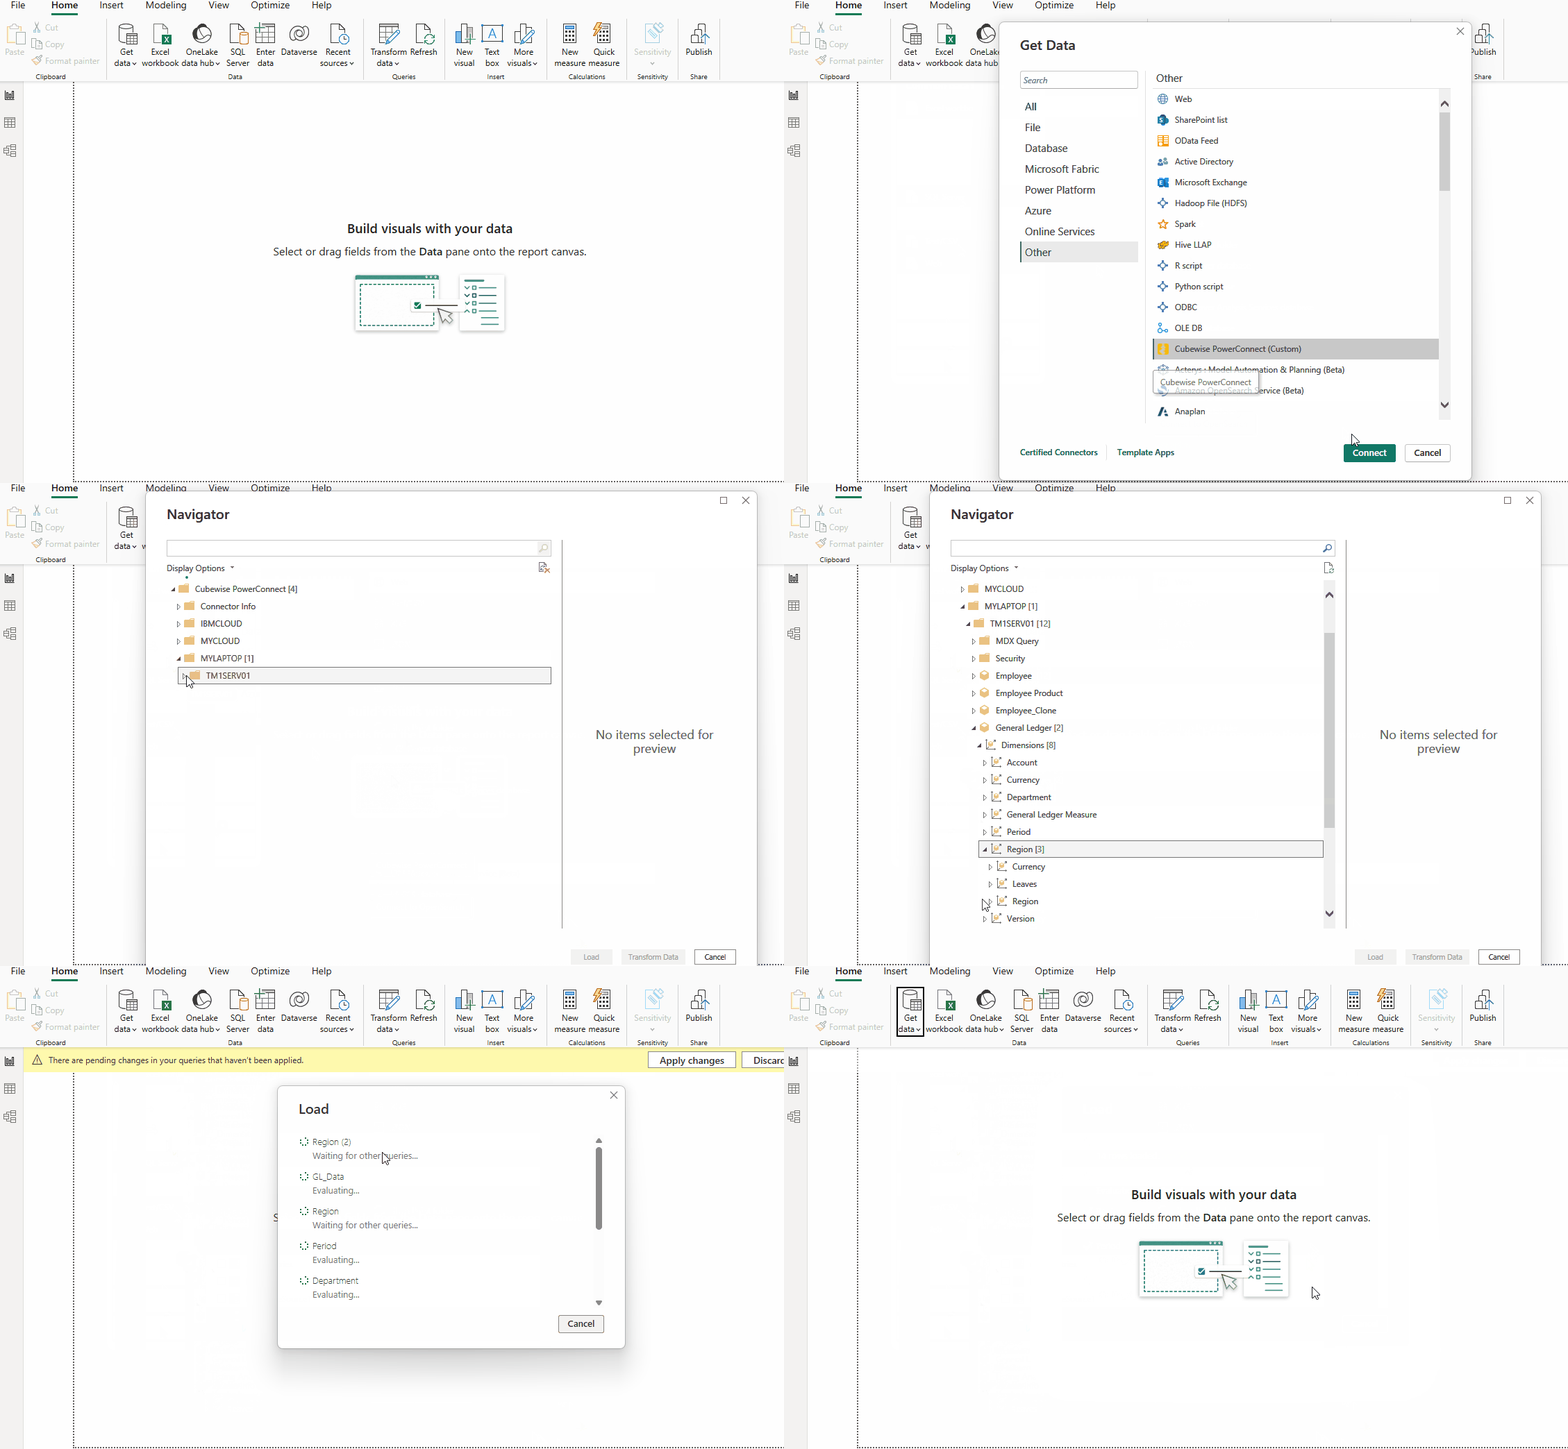
Use PowerConnect to import this dimension in Power BI with just a few clicks.

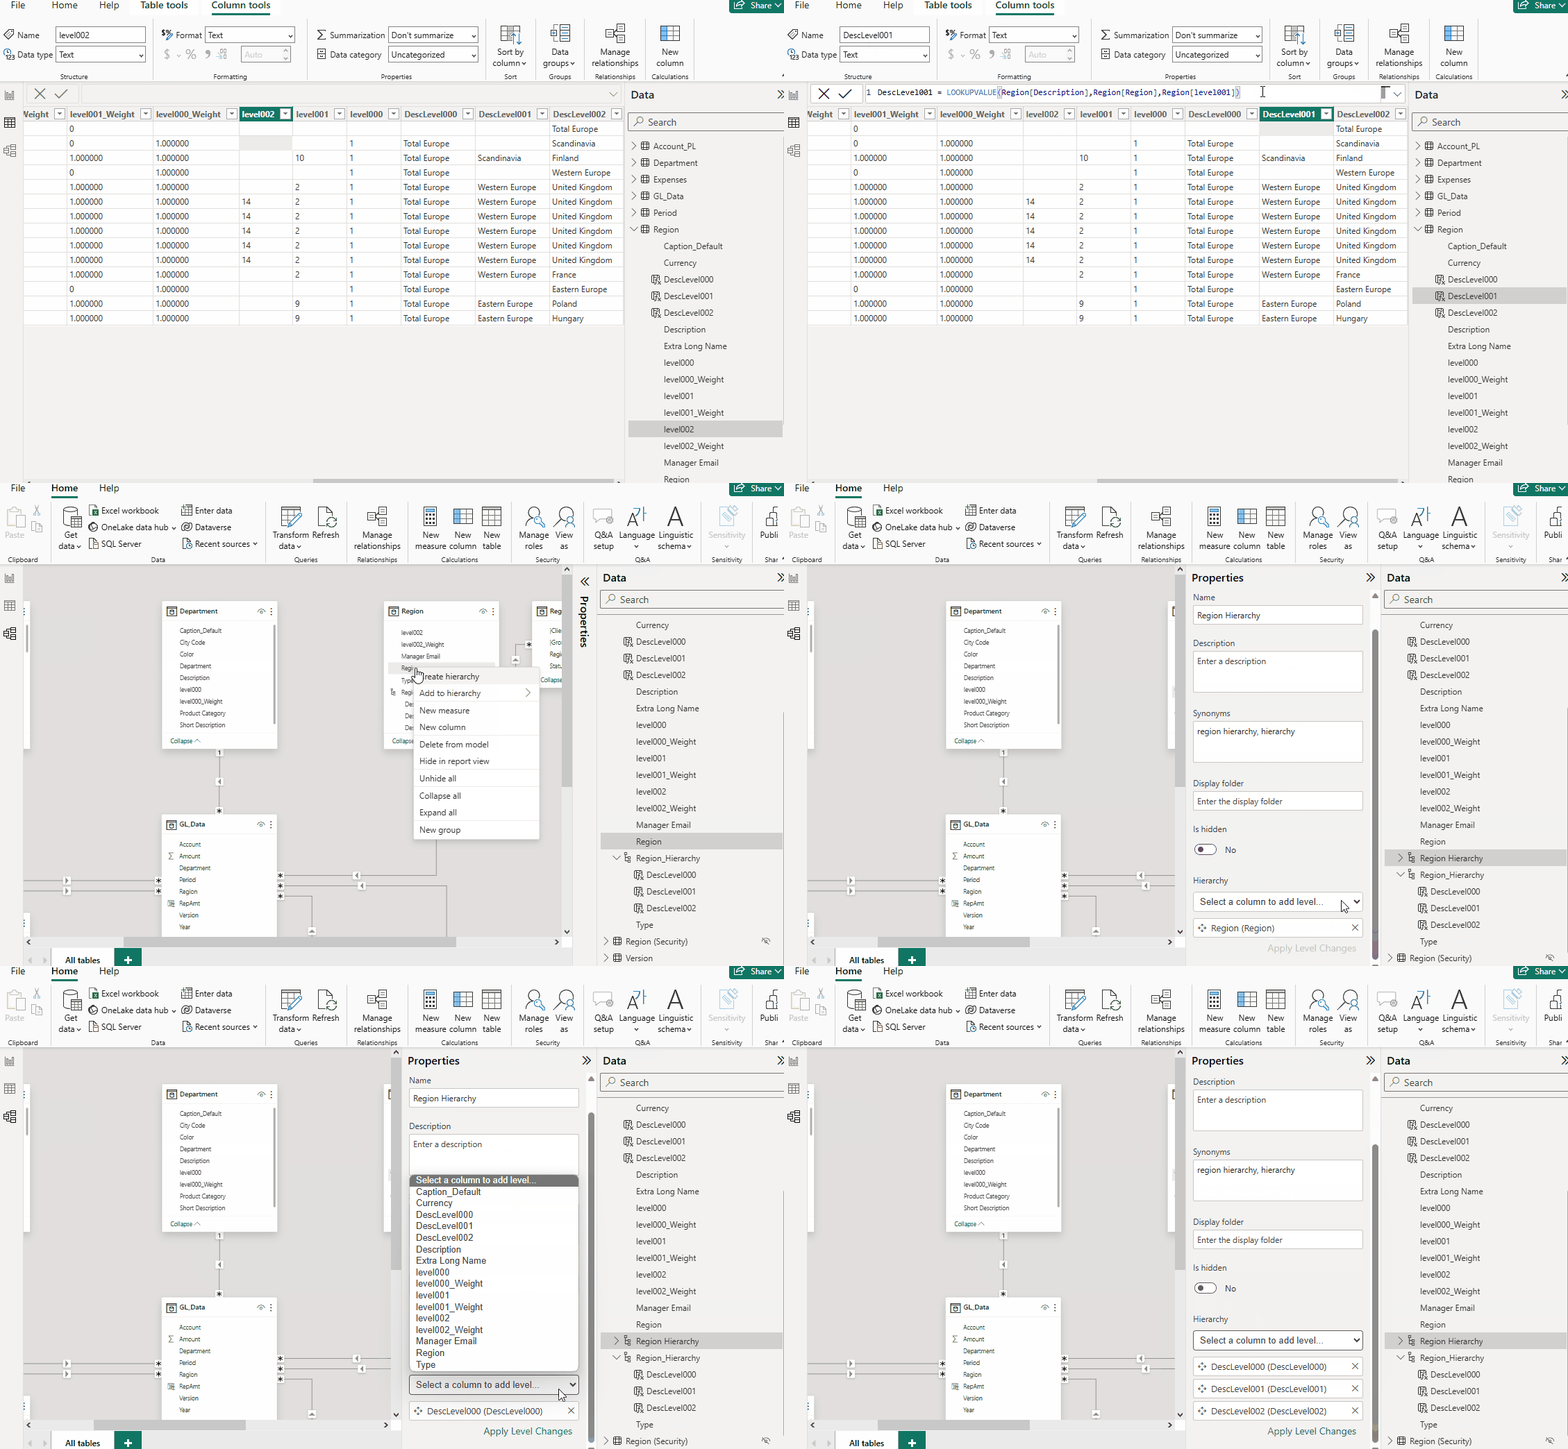
In the table view section in Power BI, create a couple of columns to return the description attribute of the different levels of the TM1 Region dimension shown as level001, level002 and so on. To do this, use a simple excel like formula:
“DescLevel000=LOOKUPVALUE(Region[Description],Region[Region],Region[level000])”
Go to the model view, select the Region dimension and create the hierarchy by right clicking in one of the items (any will do). Name the hierarchy and add the levels based on the description columns that were just created manually.

Having PowerConnect to seamlessly update hierarchies in Power BI so you can enable the ability to drill down into data hierarchically provides a clear pathway from your TM1 data model to detailed insights in your Power BI report.

While Power BI and TM1 cater to different aspects of handling hierarchies, their synchronization with PowerConnect demonstrates a plausible way to organizing metadata in a way that enhances analytical capabilities for the end user. With PowerConnect you can now leverage TM1’s robust, scalable calculation engine, offering businesses a straight forward way to keep their metadata in sync and maximizing their data analysis and business planning efforts.