

Mar 4, 2022
Using Grafana with Pulse for TM1
Starting with v6.5 Pulse comes with Openseach and Opensearch Dashboard. Opensearch is the search engine where Pulse stores the data and Opensearch Dashboard is the visualization tool powering the Pulse Explorer.
Another visualization tool which is very popular is Grafana. Using Grafana with the Pulse Opensearch data is possible.
Grafana is a monitoring and observability platform, similar to Opensearch Dashboad. One advantage of Grafana over Kibana is that the Export to CSV feature is available in the open-source version.
This article explains how to connect Grafana to the Pulse Elasticsearch cluster.
Installing Grafana
The first step is to download Grafana here and then run the installer:

Getting started with Grafana
If you are not familiar with Grafana, it is highly recommended to go through the Grafana getting started guide:

How to access Grafana
Once Grafana is installed, open your web browser and go to http://localhost:3000/.

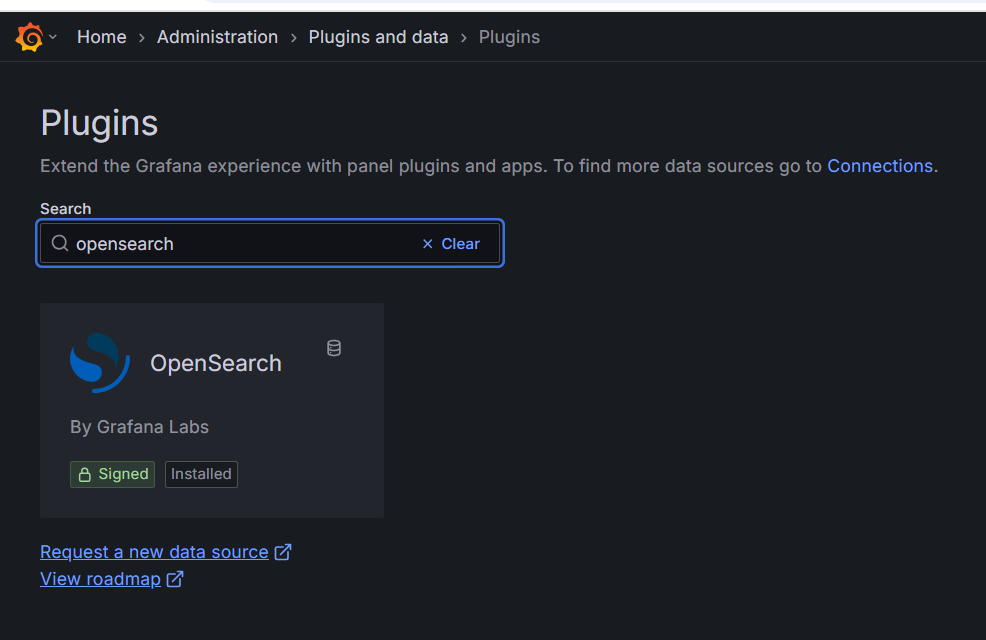
Installing Opensearch plugin
The use Opensearch as a datasource, you’ll have to install the Opensearch plugin:
How to connect Grafana to the Pulse Opensearch
To add a new data source, go to Configuration > Data Sources:

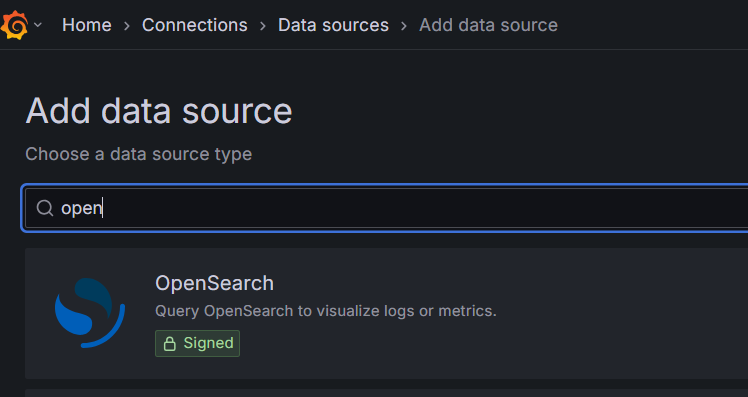
Click Add data source button:

Select Opensearch:
We will need to create one data source per Pulse Opensearch indices. More information about all indices can be found in the following article:
In this example, we are going to create one database for the pulse-tm1-server-log index storing the TM1 server logs information.
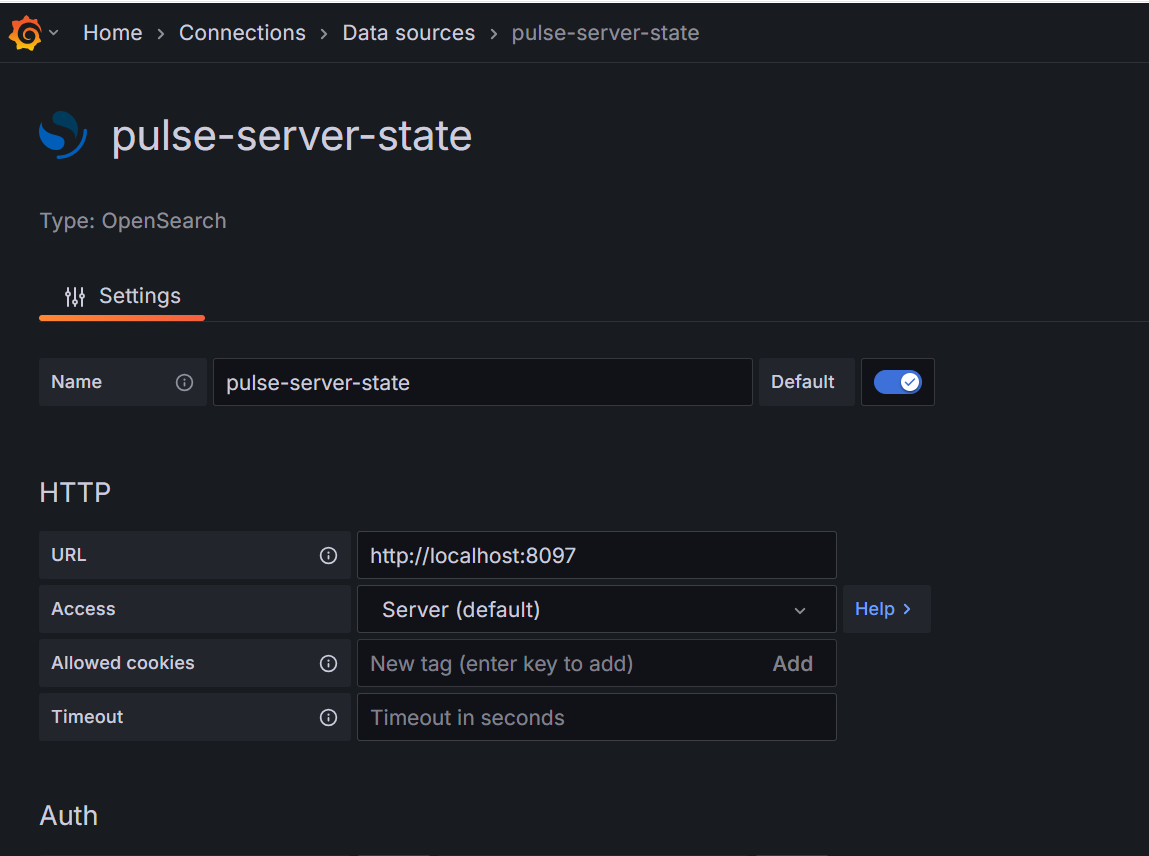
Let’s update the following information:
Name: pulse-server-state
URL: http://localhost:8097
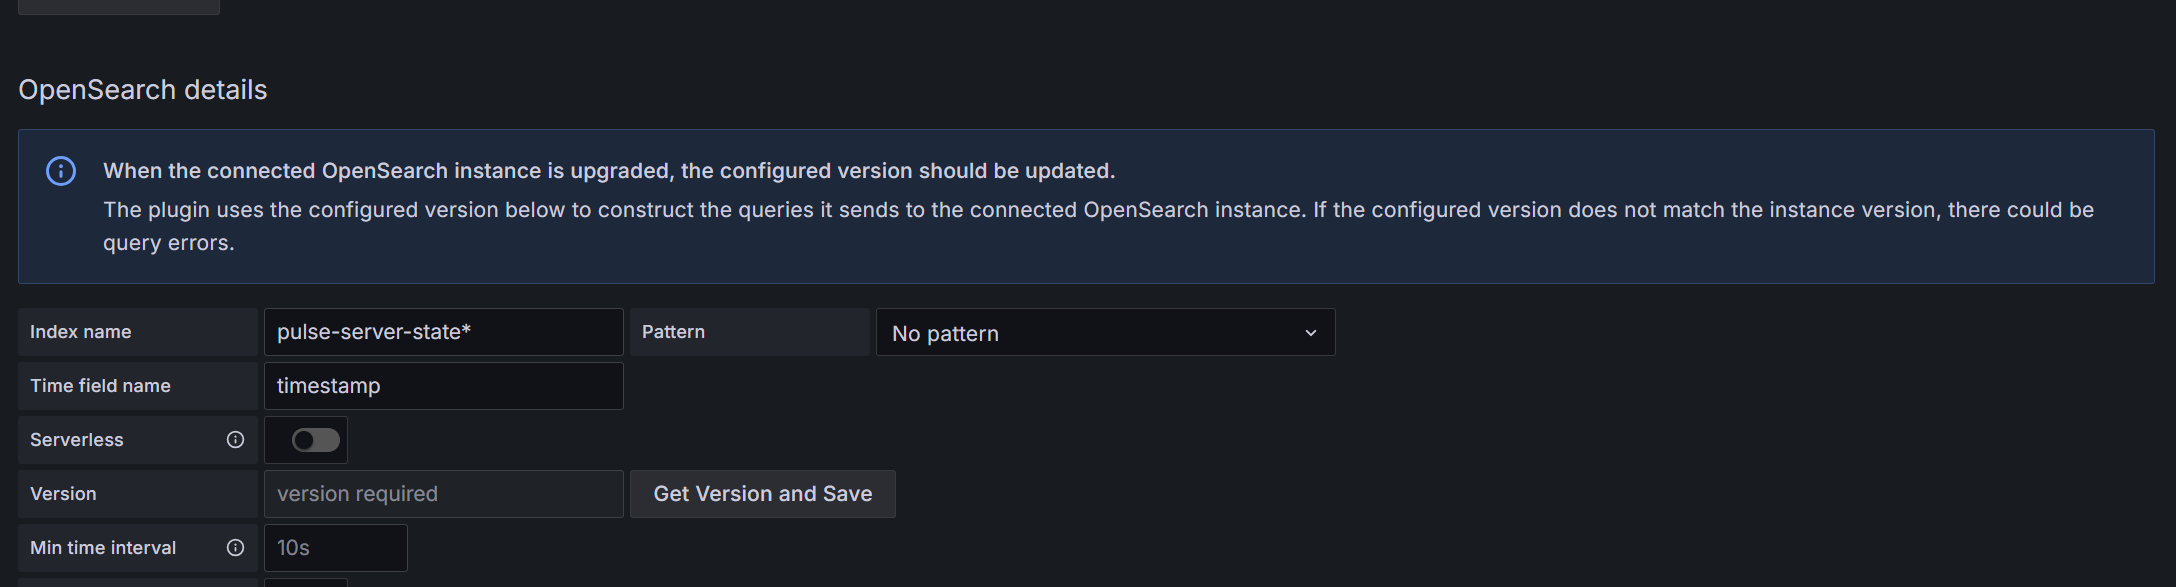
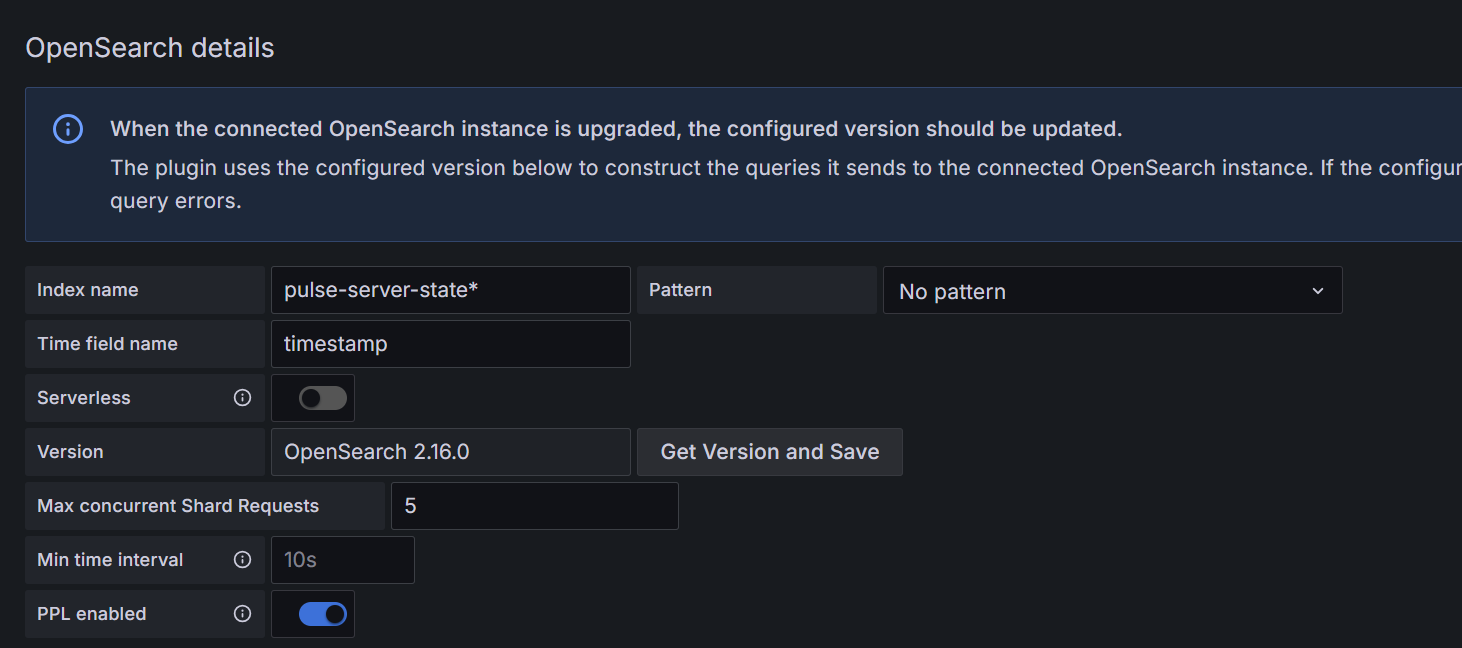
In the Elasticsearch details:
Index Name: pulse-server-state*
Time field name: timestamp
Version: Click the GetVersion button
Finally just click the Save & test button:
Import a dashboard
We created a dashboard to help you get started, just click the button below to download the JSON file.
To import this JSON file, click the + sign and go to Import:

Click Upload JSON file:

Once your file loaded, you just need to select the datasource created previously:

Click the Import button and you should be able to see the dashboard as below:

To export into CSV
Click on one-panel header then go to Inspect > Data and finally click the Download CSV button:
