Jul 2, 2022
Rewind the State of Your TM1 Applications with Pulse
Have you ever wondered what happened in your applications in the last few minutes? Or even over the last few days? Perhaps you want to know who was logged in this morning or how much memory was used last night. All of these questions can help you get a better understanding of how your IBM Planning Analytics (TM1) system is being utilized.
And all of the answers can be found with Pulse.
Pulse tracks everything that is happening across all your IBM Planning Analytics (TM1) applications (on-premise or on PA SaaS) and it stores this information in a powerful database that is built to handle large amounts of data.
Let’s have a look and see how this can help you.
What is Happening Right Now?
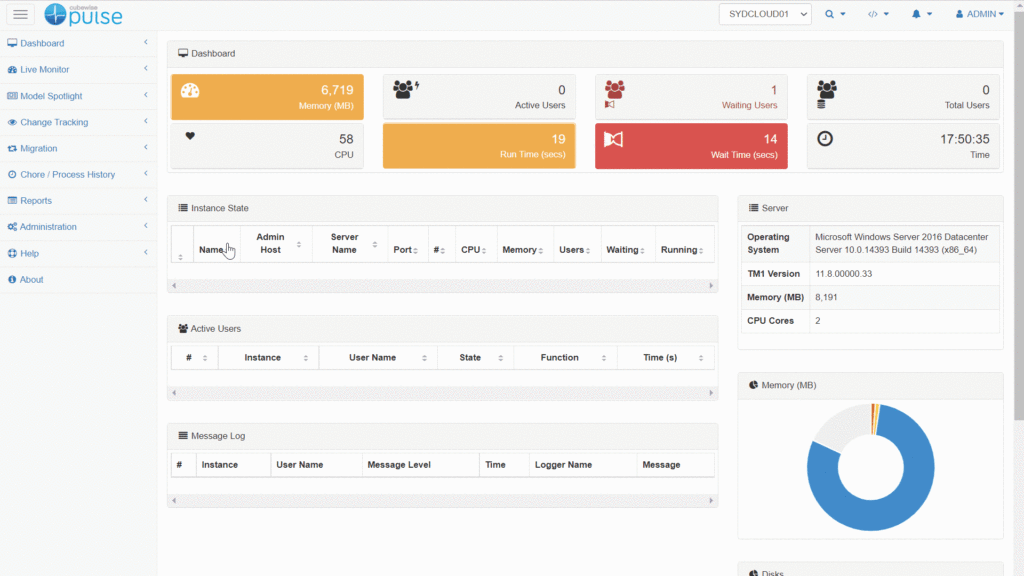
With Pulse you can see what is happening in real-time, giving you the insight to understand the current state of your application at any moment. All of the most important information gets tracked including user sessions, message logs, and a range of key metrics such as CPU and memory usage.
To make things even easier, you can set up specific alerts that will bring an issue to your attention without you having to sit and watch the screen. This allows you to act quickly and decisively before your users even notice it.
Understanding What Has Happened
Thanks to Pulse you can also look back at what has already happened. Getting a good understanding of past events within your system helps you to fix issues more effectively and to make improvements and enhancements that will make a difference for your users.
As an example, Pulse allows you to see if a process is slower than it used to be – giving you a chance to check the Change Tracking feature to see what changed and which line of code might be causing it to run slower.
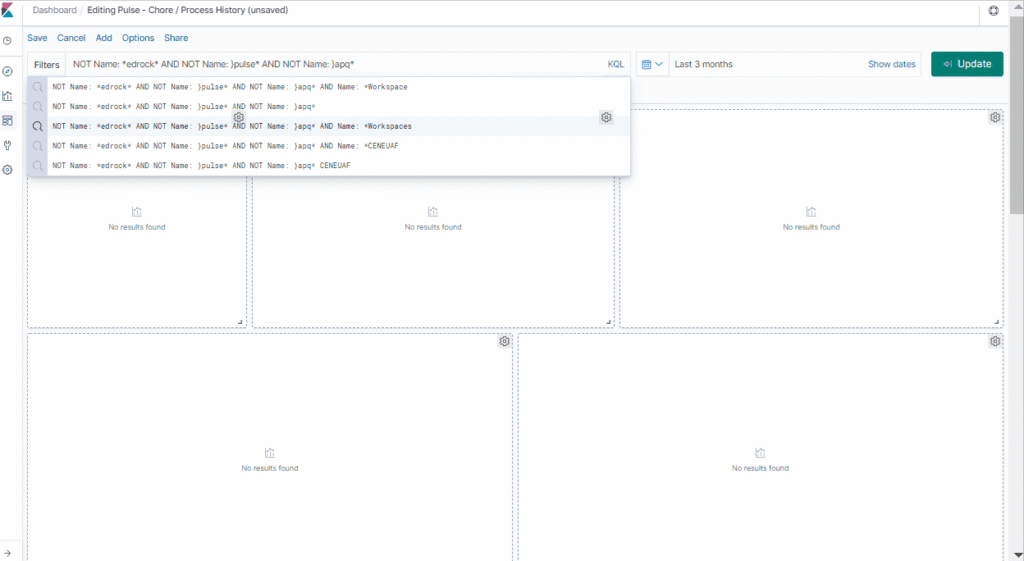
All the data is available at a very granular level and it is stored in a powerful database that can be leveraged in a wide variety of different ways. This data can then be retrieved with an intuitive visualization tool, called the Pulse Explorer.
Rewind the state of your application at any time
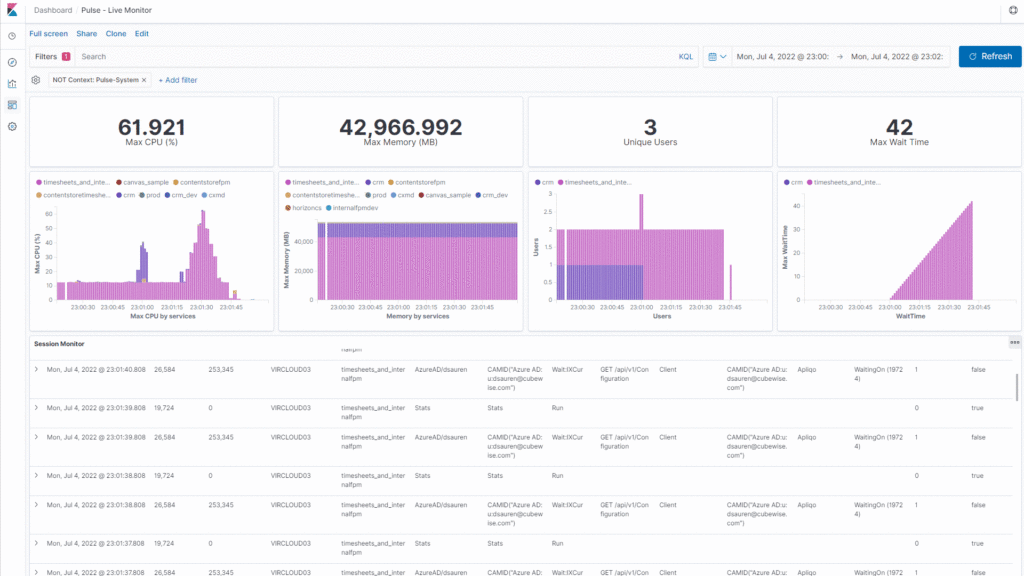
With the Pulse Explorer, you can rewind the state of your application at any time. This means that you can see who was logged in 2 hours or 2 days ago, what they were doing, and what was running – to help you diagnose a potential problem.
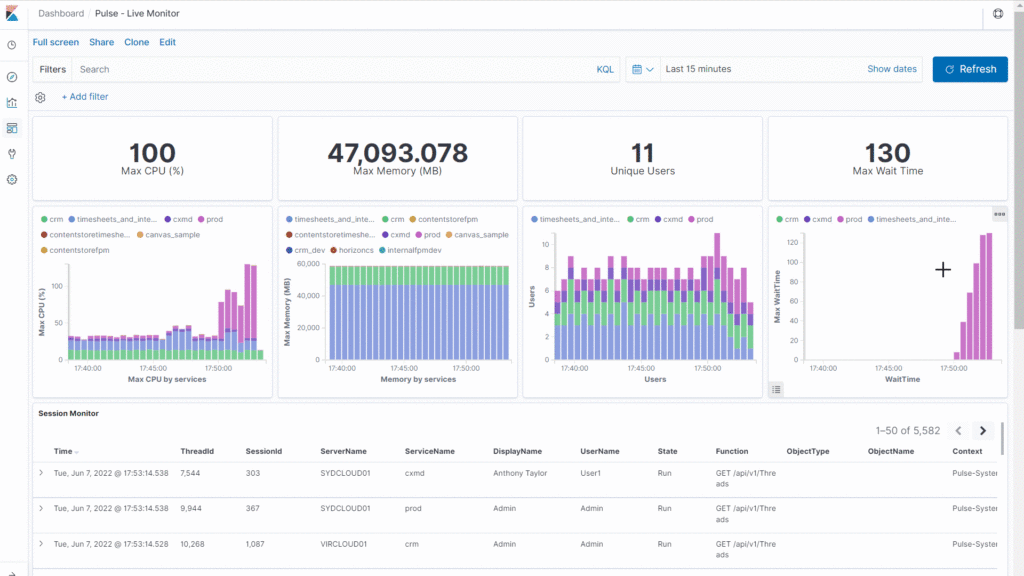
As you’ll see in the example below, you can be very precise with how you rewind the state of the application. In this case, you can see all the sessions and the message logs between 23:00:00 and 23:02:00 on the 5th of July:
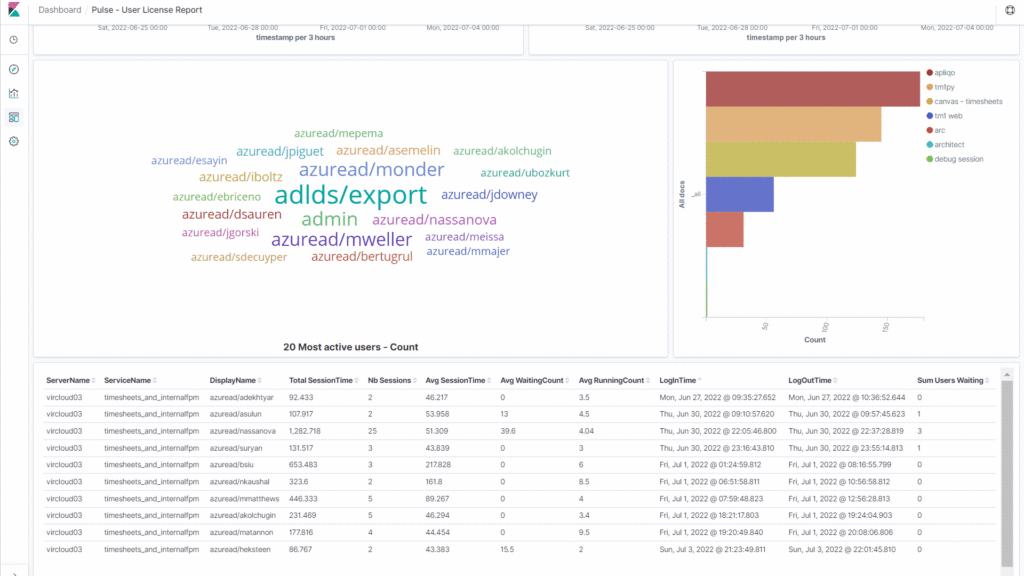
You can also analyse what your users are doing, when they connect, and which tools are they using within the wider ecosystem. Pulse makes all of this possible – allowing you to see who is using what (TM1 Web, Workspace, Architect, Arc, TM1py, etc.)
Conclusion
For the first time in the history of IBM Planning Analytics (TM1), it is now possible to easily rewind the state of your applications at any time and on a second-by-second basis. This is just one of the many features of Pulse, and if you’re a TM1 administrator or developer, you should really check what else Pulse can offer to you to make your life easier.