Feb 4, 2022
Making Sense of Past Events with Pulse

As your financial system gets larger and more complex, you’re exposed to a wide range of users and will inevitably bump up against performance challenges that come along with the increased scope. No matter how much effort you put into creating highly efficient and optimized workflows and processes, you’re never going to escape user complaints such as:
“The application isn’t performing as it should…”
“The process is much slower than it used to be…”
“Something is going wrong with the way the application runs…”
Unfortunately, as the developer, you might not always have control over how to fix these problems. It could be due to network issues, improper usage of the application, or other software getting in the way. But none of this is acceptable to the user. They want to know what’s going on and as the application owner, you’ll need to provide factual information to back up your response.
Pulse offers some powerful functionality when it comes to understanding issues in the past and we’re going to use this article to walk through some of these examples:
Example 1: The Application is Slowing Down.
Let’s explore how Pulse can help you identify why an application might be slowing down.
Is the user really waiting?
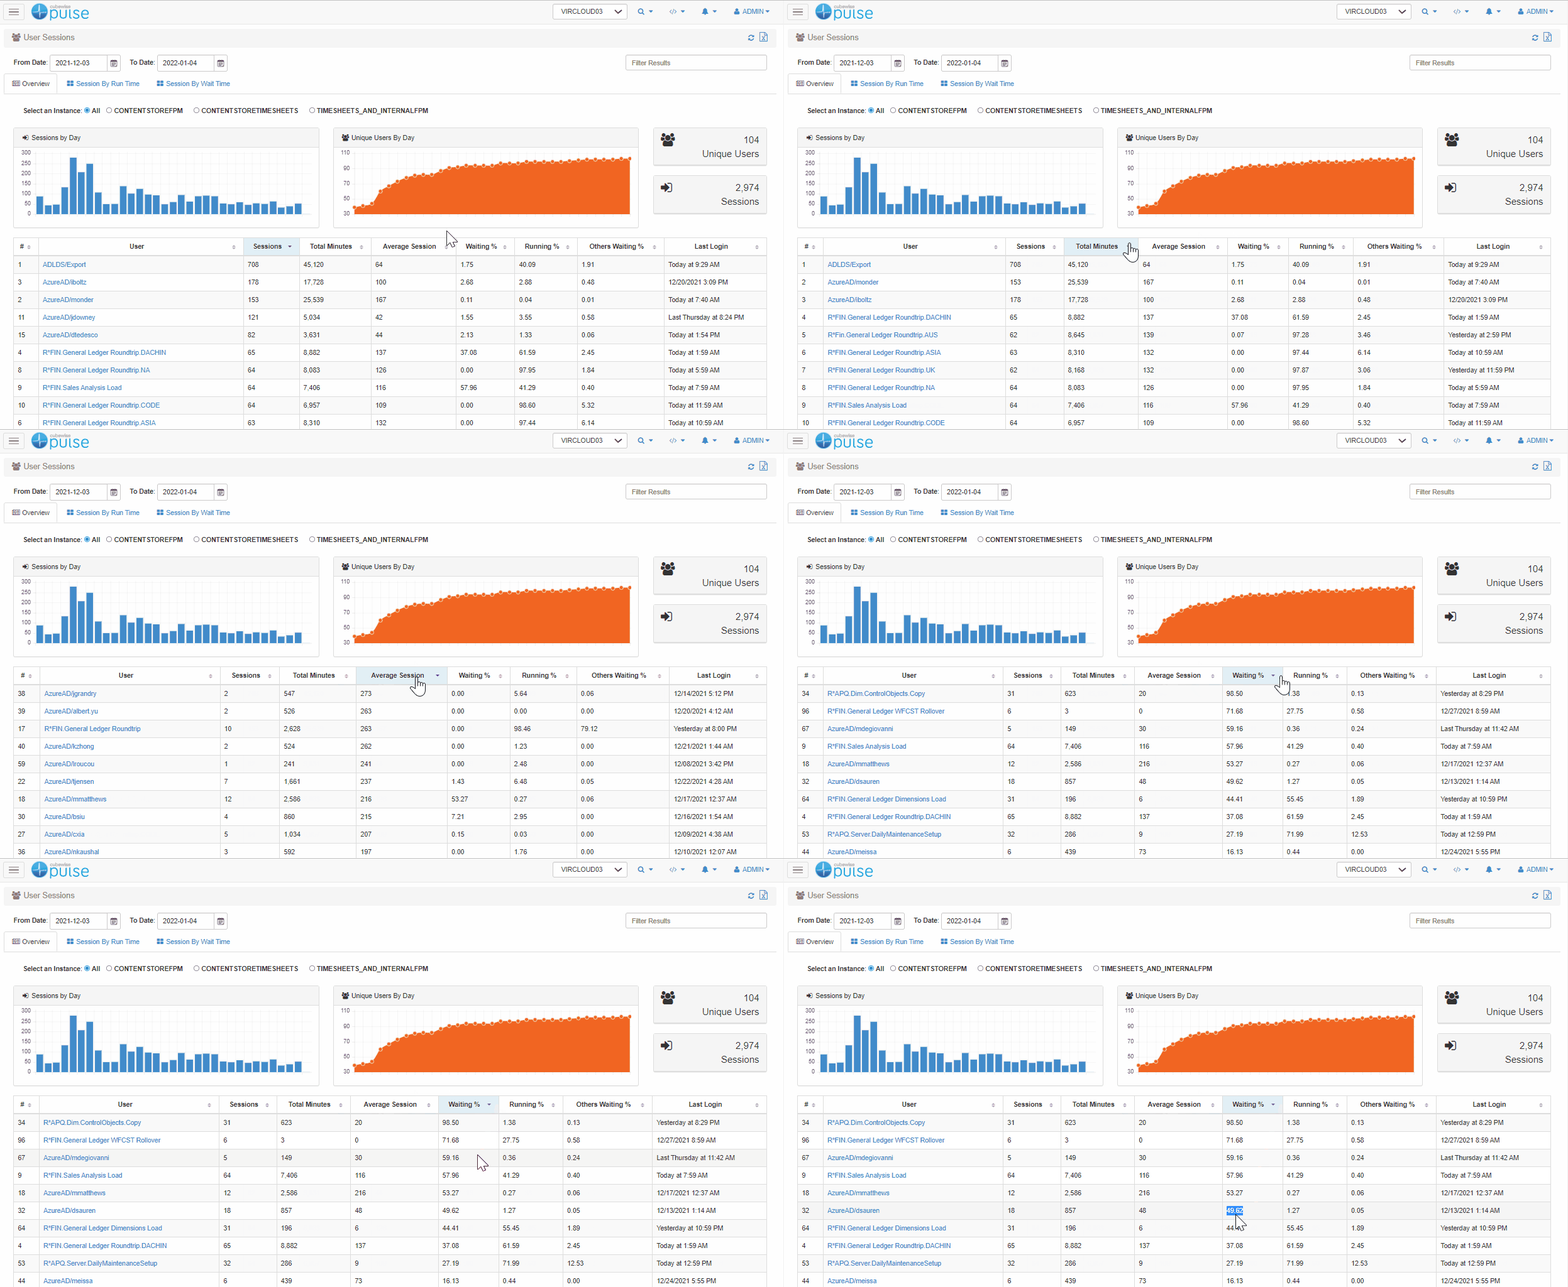
The first thing we need to do is confirm whether the user is actually waiting, and for how long they’re doing so. Pulse keeps track of every single user session so you can see what percentage of a user’s time is spent waiting.

In this example, you can see that less than 1% of their time was spent waiting which suggests that perhaps the user is exaggerating the complaint and there is no real issue.
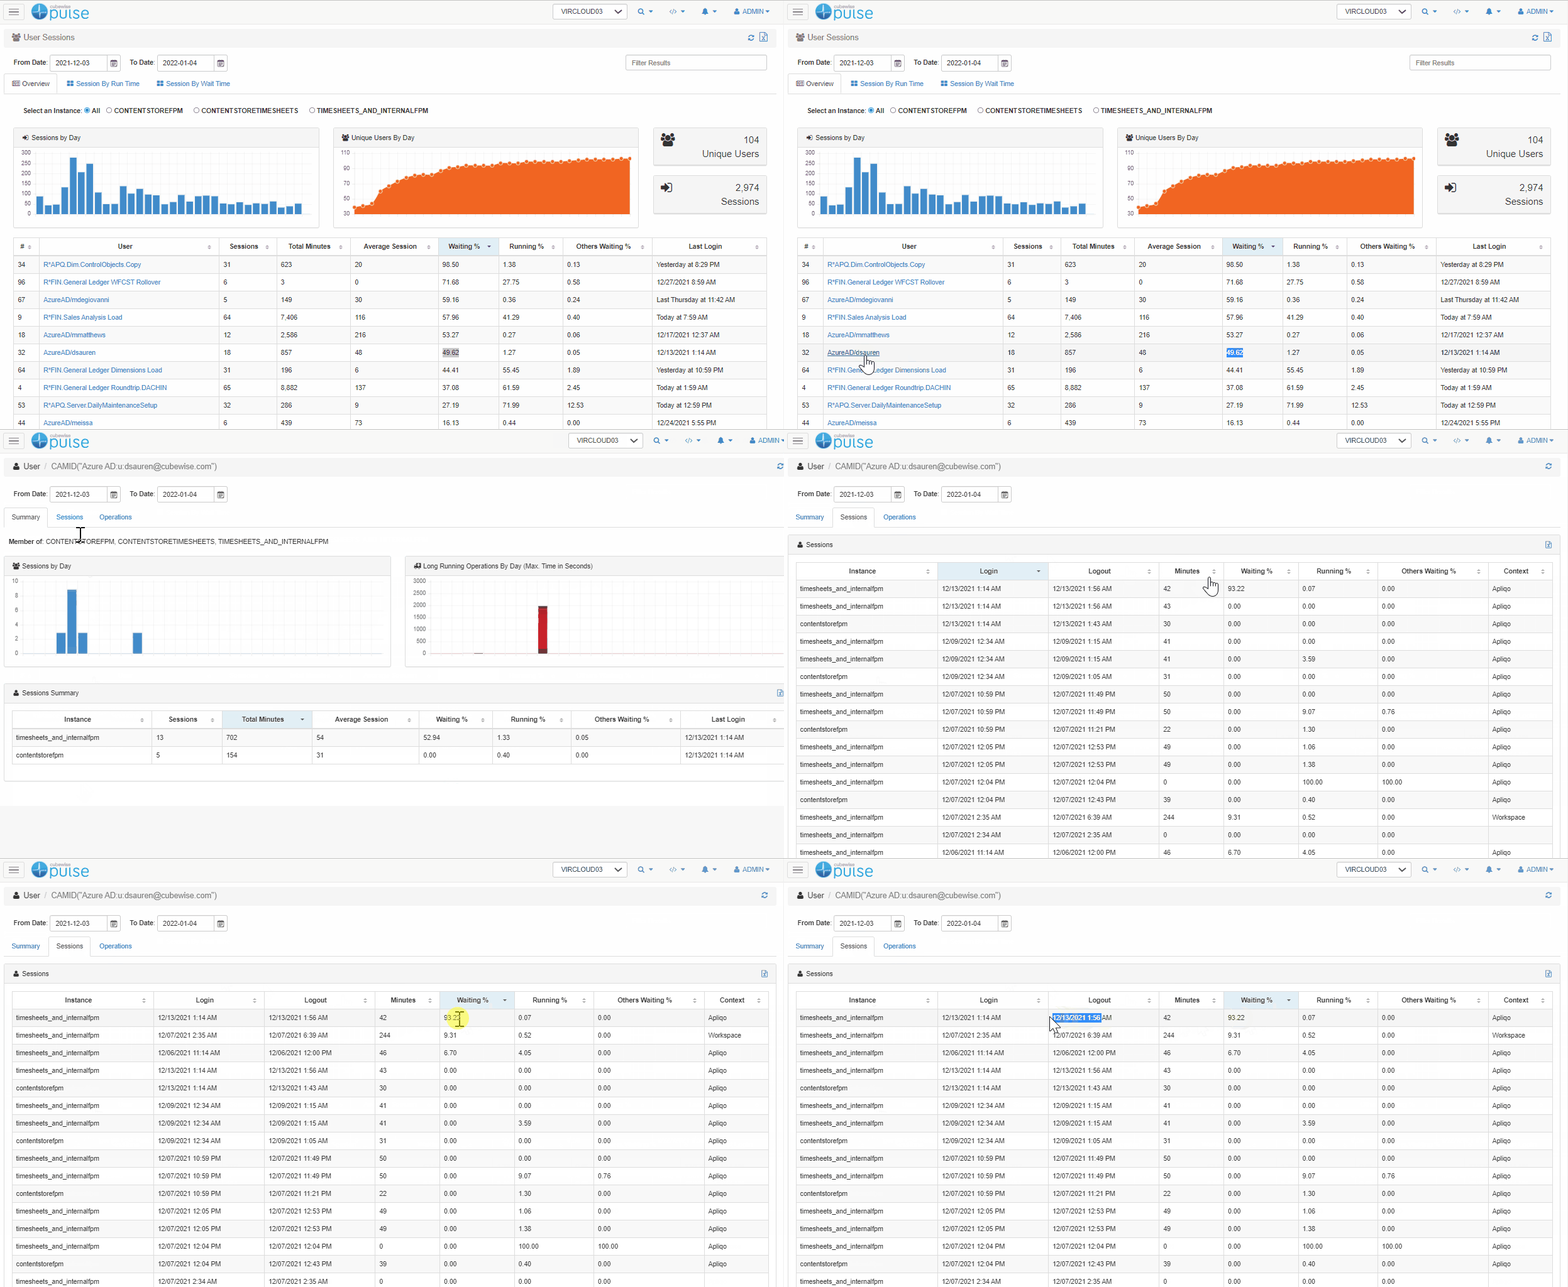
Check each session.
By clicking on the user, you can then get more details about each and every session. In the example below, we can see that there was only one session where the user was waiting a long time (93%) and this was at 1:56 AM when the maintenance chores are running.

Report back to the user.
Because of this data, you can then go back to the user and explain to him that while it’s true that he was waiting on the application, this was due to the fact that he was using it outside working hours when the maintenance chores were running. Pulse was able to help us uncover when the user was waiting and why he was waiting.
Example 2: I ran this process a few days ago and it took a long time.
Let’s say that a user often runs a particular process but one day it starts taking longer than it normally should. In an attempt to try and run the process yourself, you find that it happens fast once again and you don’t see any issues. What do you do? What can you say to the user?

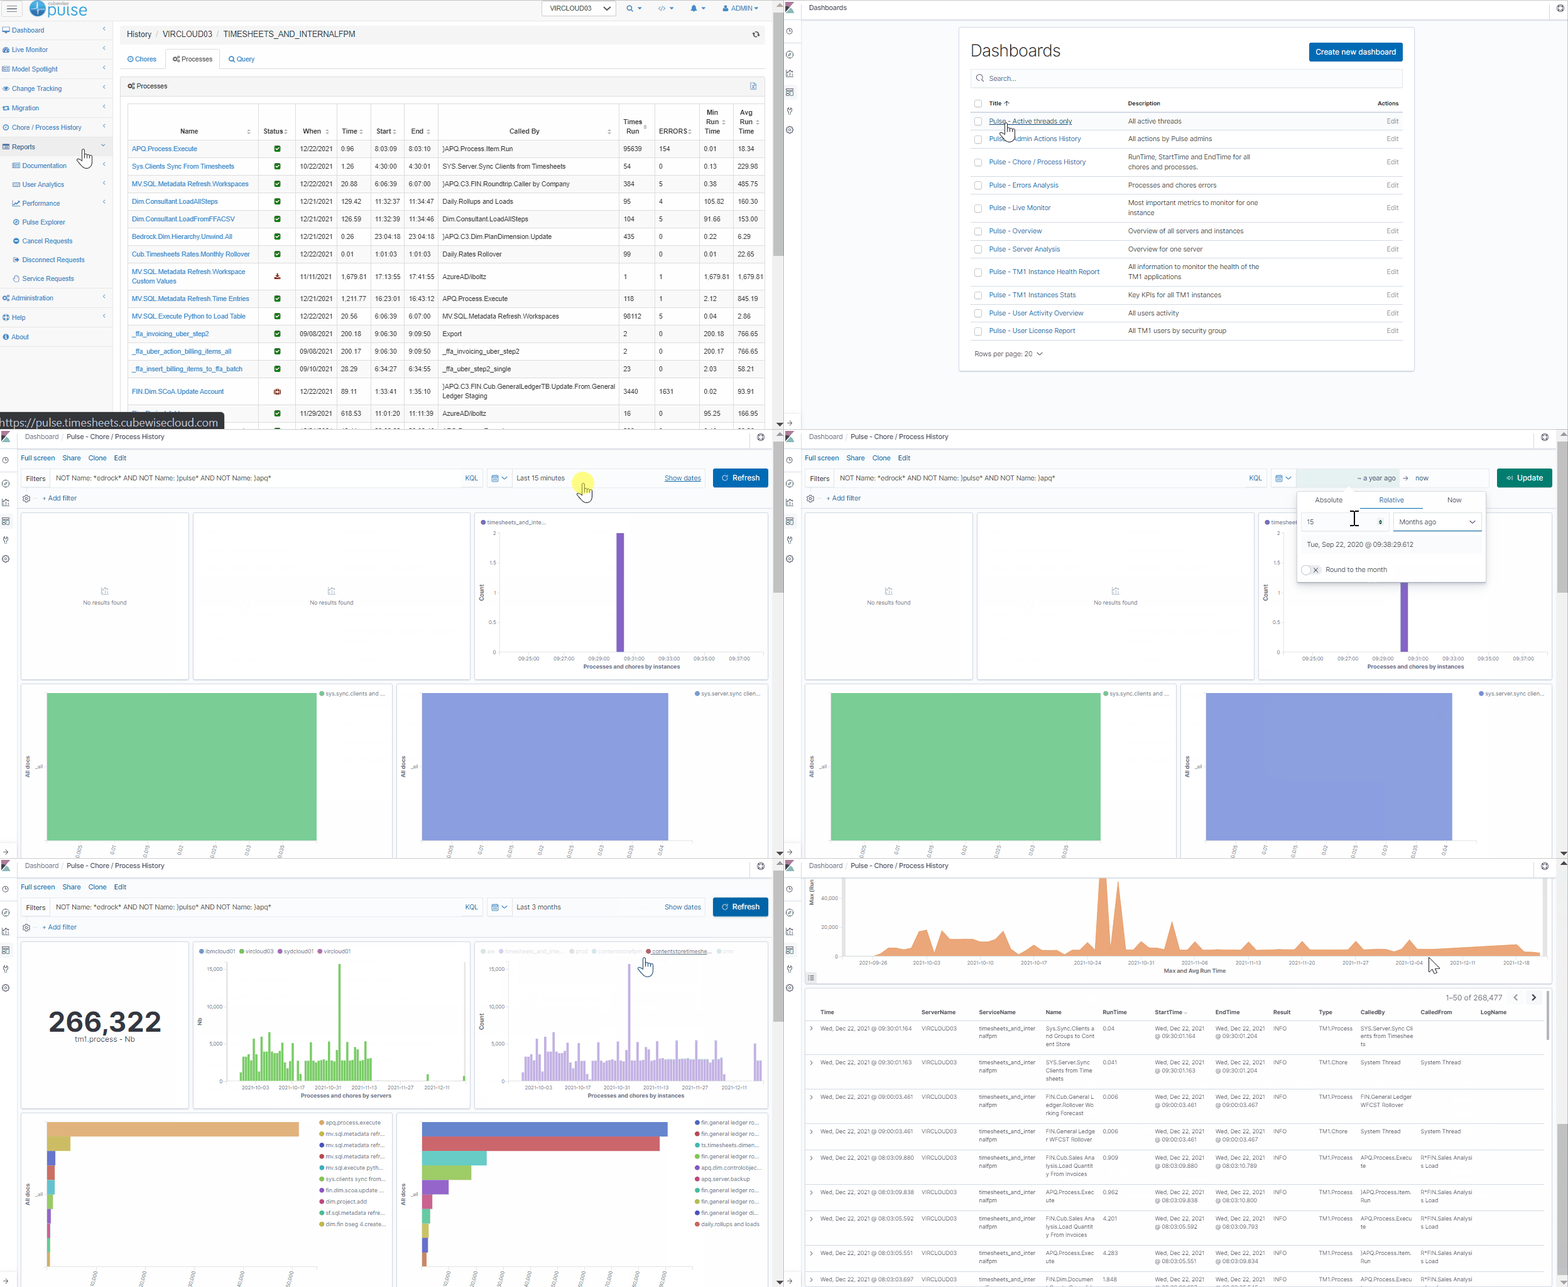
As you can see in the screenshot above, Pulse keeps track of all the processes and chores that are run across the board. By digging into this information, you can quickly find the Min, Avg, and Max Run Time for a specific process. In this example, we can see that there is a massive difference between the Min (0.5 sec) and Max (4,000 sec). Now that we are armed with that insight, we want to dig further to understand this discrepancy.
To understand what was happening when the process was slow, you can open the Pulse Chore/Process History dashboard from the Pulse Explorer as follows:

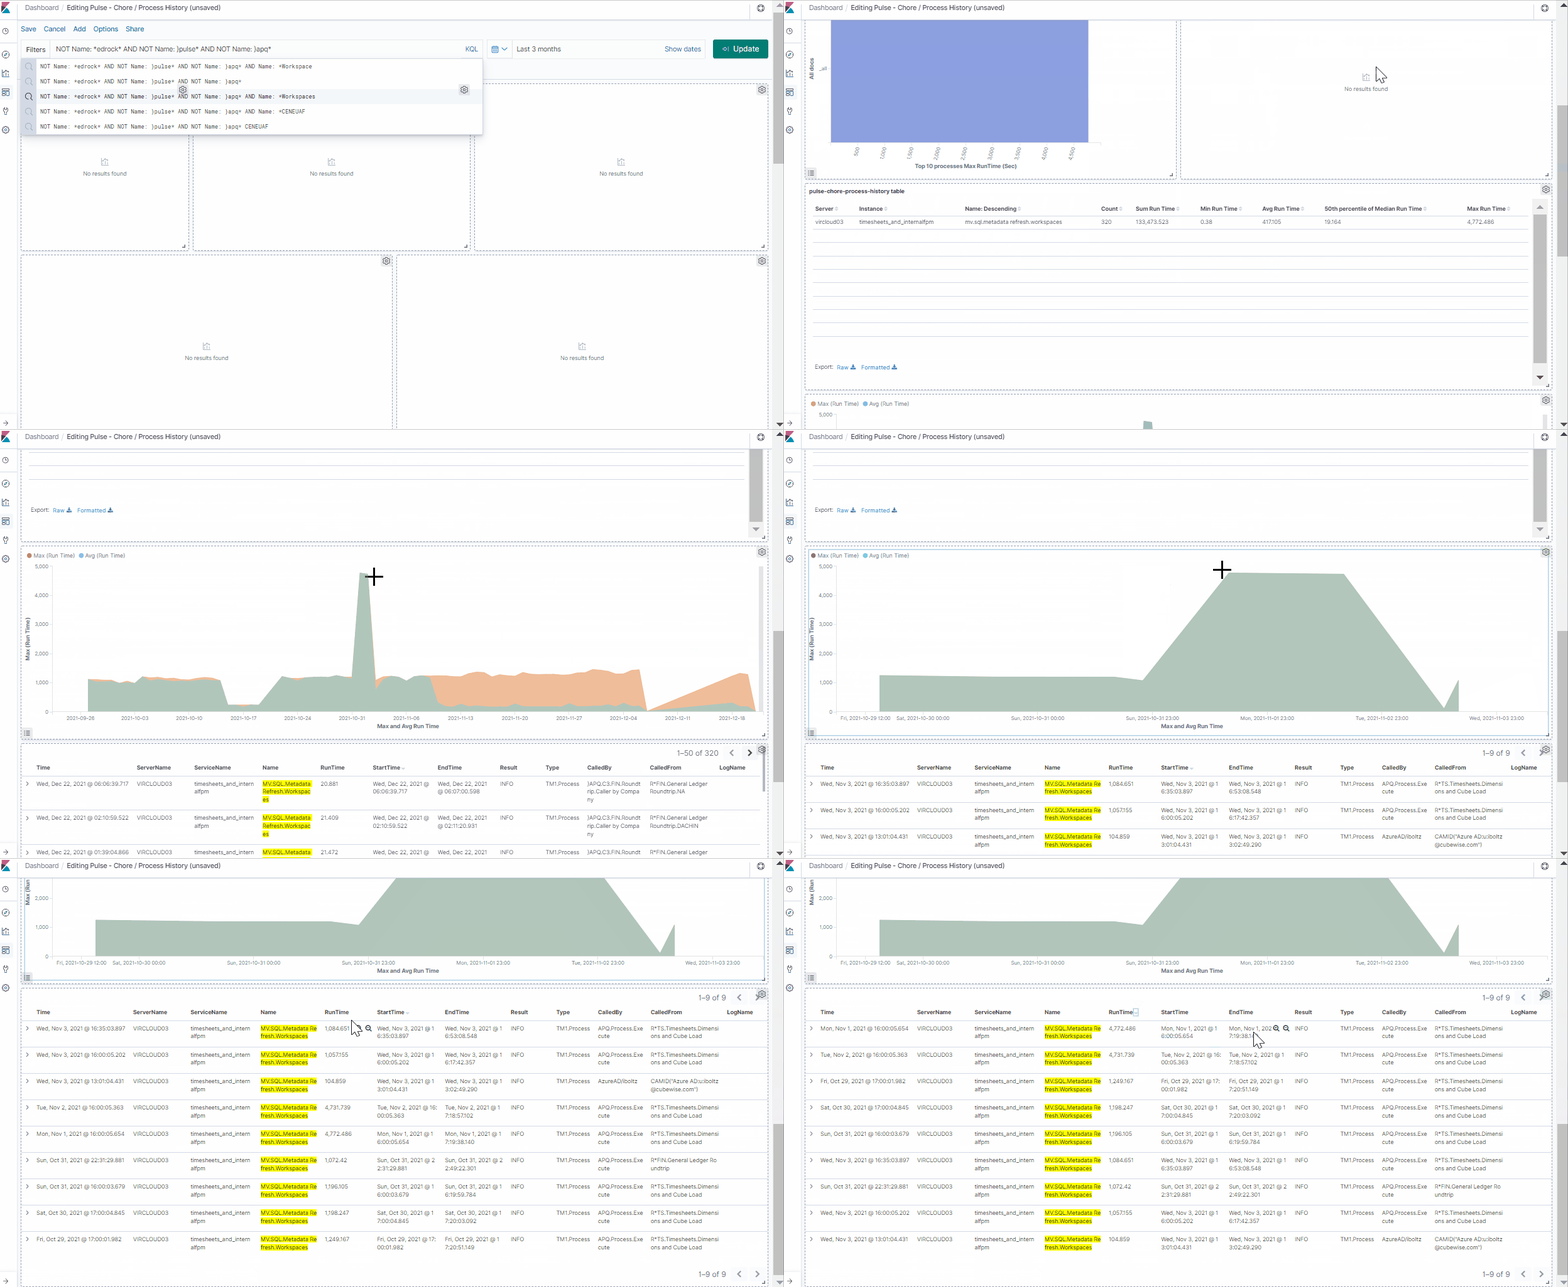
In this report you can then filter by the process name to focus on one process by typing Name: * ProcessName as shown below:

Once the dashboard is filtered, you can quickly use the chart to see when the maximum runtime happened. In this case, it was on the 1st of November 2021 at 16:05.

The next step is to understand why this anomaly occurred. There must have been something locking this process.
If you open the Active Thread dashboard in the Pulse Explorer and filter the data to look at the specific timestamp of 1 November 2021 at 16:05, you will be able to see all the threads that were running at that specific time.
In this example, we can see that the thread which was locking our process was a process that was doing a clean of the views and subsets.

Now you can take this information back to your user and give them a factual understanding of why they experienced the lag that they did. Pulse helped us to find out when the maximum execution time happened and more importantly, why it happened.
Conclusion
Whenever you are building a new application, it is crucially important to think about the administration and support that is required to maintain it at scale. Ensuring that you can use performance data to explain performance anomalies should be best practice for any TM1 application. This is called observability – the ability to answer pretty much any question about your system with real data.
Having this insight helps you to keep a keen eye on what’s going on in your application, but it also assists with communicating with users who face problems and frustrations as they use the applications. It cuts through the emotion and provides a factual basis that can only serve to supercharge your application and its impact on the organization.
Check out Pulse, if you haven’t already, if you want to bring this superpower to your team.
More about Pulse for IBM Planning Analytics
Explore the full list of Pulse features