

Mar 5, 2018
Debugging a TM1 process
What is debugging?
Debugging code allows you to step through line-by-line and see what the values of the variables are as you go. No need to write out to ASCII files with what is going on in TM1 process anymore.
Enable debugging
To enable debugging you need to add the following parameter to the tm1s.cfg file and then restart the TM1 instance:
EnableTIDebugging=true
Run a process in debug mode
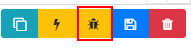
To debug a process click on the button on the open process:
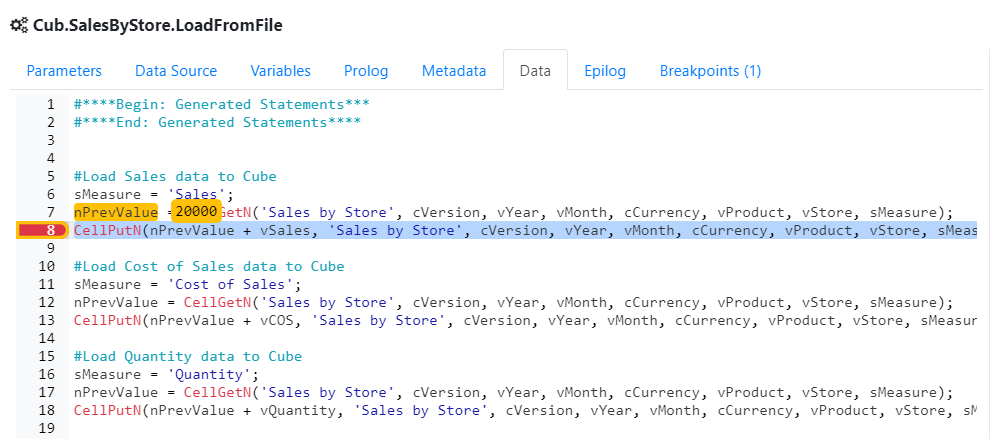
Once debugging has been initiated it will stop on the first line in the Prolog. To navigate through the code use the Continue, Step Over, Step In and Step Out buttons:
Continue: Run code until the end of the process or a breakpoint.
Step In: Moves line to line and will also enter a child process called by the ExecuteProcess function.
Step Over: Works the same as Step In by moving line to line except it DOESN’T enter a child process called by ExecuteProcess.
Step Out: Continues until the end of the child process and then stops at the next line in the calling process. This should be used with Step In to exit a child process called via ExecuteProcess.
Breakpoints allow you to stop the execution of code at a particular point, currently Arc supports line based breakpoints. To add one click on the left hand side of the line number in the code editor. This will create a new simple breakpoint that will stop the code each time you debug.

Add a condition to a breakpoint
You can add a conditional expression to the breakpoint to make it stop only when a variable is a certain value. To do this click on the Breakpoints tab and enter the expression as below:

You can also use the Breakpoints tab to enable/disable breakpoints while you are running the process.
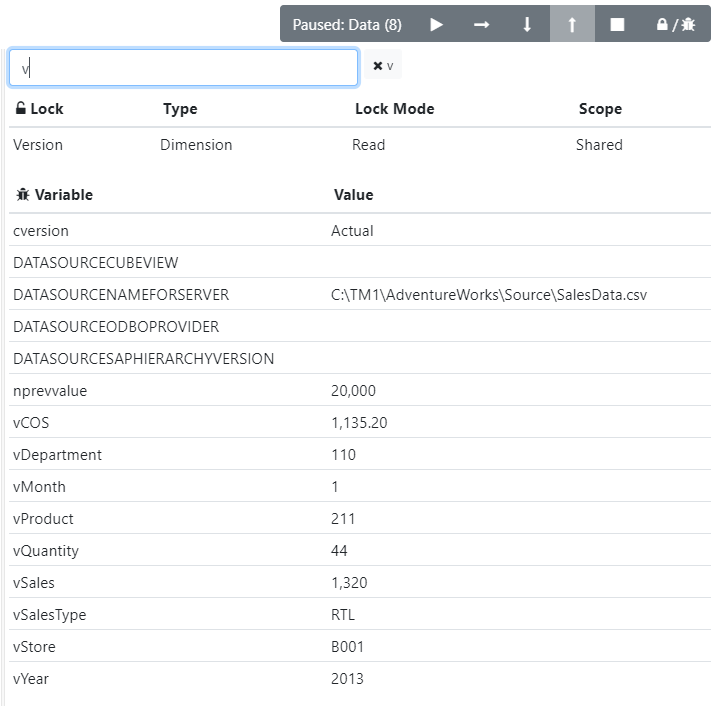
While debugging, you can hover a variable to see the value:
On the right pane, you can filter the list of variables to focus only on the variables you are interested on:
Watch the video:
Happy debugging!!